Abstract
The association between an achiral copper(II) host (1) and chiral carboxylate guests was studied using exciton-coupled circular dichroism (ECCD). Enantiomeric complexes were created upon binding of the enantiomers of the carboxylate guests to the host, and the sign of the resultant CD signal allowed for determination of the configuration of the studied guest. The difference in magnitudes and shapes of the CD signals, in conjunction with linear discriminant analysis (LDA), allowed for the identity of the guest to be determined successfully. A model was created for the host:guest complexes which successfully predicts the sign of the observed CD signal. Further, Taft parameters were used in the model, leading to rationalization of the observed magnitudes of the CD signals. Finally, the enantiomeric excess (ee) of unknown samples of three chiral carboxylic acid guests was determined with an average absolute error of ± 3.0%.
INTRODUCTION
Determination of the enantiomeric purity of chiral compounds is performed routinely in synthetic organic chemistry.1–7 Chiral carboxylic acids are common functional groups found in pharmaceuticals, as well as intermediates in the synthesis of complex natural products.8–11 Therefore, catalytic asymmetric methodologies have been commonly directed to the creation of chiral carboxylic acids.
High-throughput screening (HTS) has emerged as a means for discovery of asymmetric catalytic reactions.12 A large number of reactions are carried out in parallel in order to screen for improvements in enantiomeric excess (ee) for a target reaction. These ee values are most commonly ascertained using either high performance liquid chromatography (HPLC), or gas chromatography (GC).13–16 Although these techniques are very accurate, they are unable to keep up with the number of samples that are created when several hundreds of reactions are run in parallel. Increasingly large numbers of samples also inherently increases the amount of solvent used, preparation time required, and cost incurred. For these reasons, there is a desire to create more efficient methods that can expedite the process of ee determination. Several methods have been successfully implemented, utilizing such techniques as NMR, fluorescence, UV/Vis, or calorimetry.17–27 However, several of the procedures require chiral hosts created through extensive synthetic efforts. Additionally, many require that the analyte be derivatized before the analysis can be preformed. For these reasons, it is desirable to create methods that avert these drawbacks.
To this end, our group and others have focused on developing assays that allow the rapid determination of reaction success, both in terms of ee and yield.28–37 In one approach, enantioselective indicator displacement assays utilizing colorimetric indicators have been combined with pattern recognition techniques to find the ee of several types of chiral analytes, including α-amino acids, diols, and α-hydroxycarboxylic acids.28–30 In a disparate approach, metal-to-ligand charge transfer (MLCT) bands were analyzed using circular dichroism (CD) spectroscopy. We showed that this approach allows for the rapid determination of ee, in conjunction with concentration and analyte identity.31,32
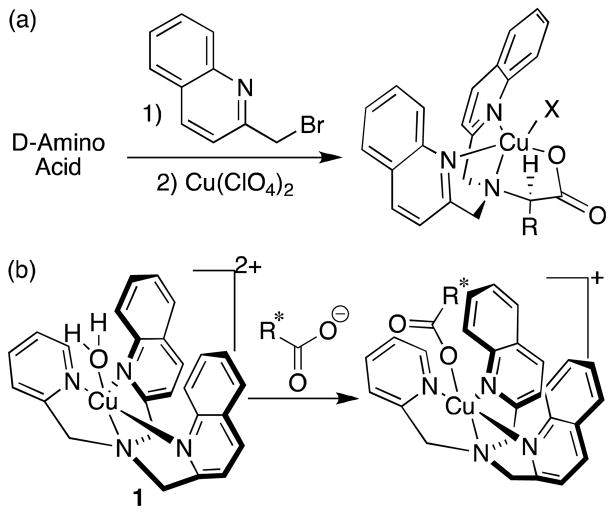
One form of CD, known as exciton-coupled circular dichroism (ECCD),38 has often been applied by the Canary group,39–44 as well as others,45–51 for similar goals. The couplets seen in ECCD have allowed for determination of ee, as well as absolute configuration, of α-amino acids, β-amino alcohols, and primary amines.39–41 The approach from the Canary group begins with derivatization of the chiral analyte with quinoline chromophores, followed by complexation to a metal center. This complexation, to either CuII or ZnII, brings the quinoline groups into close proximity in a helical fashion. The helicity is determined by the stereocenter of the derivatized analyte, leading to enantiospecific CD spectra (Eq. 1a). We report herein a combined group effort to create ECCD methods for the analysis of chiral carboxylates that does not require prior derivatization of the analytes.
Eq 1.
(a) Protocol to determine absolute configuration of chiral amino acids. (b) Proposed complex formation between [(BQPA)CuII(ClO4)2] host 1 and chiral carboxylate guest.
RESULTS AND DISCUSSION
1) Design Criteria
Our new approach involves the complexation of achiral [(BPQA)CuII(ClO4)2] host 1 with chiral carboxylic acids (Eq. 1b), and avoids the step of analyte derivatization. This approach finds its roots among classic work carried out by Pfeiffer, used to resolve certain chiral coordination complexes in the early days of coordination chemistry.42,43 He observed that racemic transition-metal complexes adopted chiral properties in the presence of chiral additives. The perturbation of the equilibrium between enantiomeric metal complexes led to mixtures of diastereomers, and hence resolution of the metal complexes could be achieved.
Host complex 1 was selected for our purposes for two main reasons. First, its synthesis is straightforward. It can be prepared in three steps from commercially available starting materials.52–54 Second, an available coordination site on the copper center was expected to accommodate a chiral carboxylate anion. The analyte binding was postulated to cause a helical distortion of the complex geometry, the direction of which would be indicated by the guest’s stereochemistry. This should allow the analysis to be performed directly on unmodified analytes. In addition to obviating analyte derivatization, the binding between host and guest occurs upon mixing, and the CD spectra can be obtained quickly using a robotically interfaced liquid controller that is commercially available from JASCO.
2) X-ray Analysis
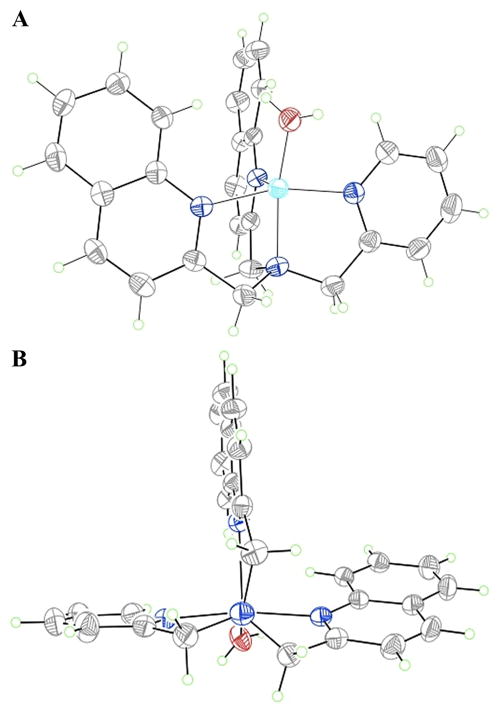
We first set out to determine the geometry of complex 1. It was expected that the tetradentate tripodal BQPA ligand would occupy four of the five coordination sites of the copper metal. This empty site would accommodate the carboxylate guest, and release a molecule of solvent that had been occupying this coordination site. The crystal structure obtained (Figure 1) of host 1 confirmed the hypothesis about the coordination involving the metal center, with a molecule of water occupying the vacant coordination site. The copper(II) atom in this structure is best described as a distorted square pyramidal geometry with three nitrogen atoms and the water oxygen atom occupying the basal plane and one quinoline nitrogen atom coordinating in an apical position. The geometry is distorted towards trigonal bipyramidal, and indeed Karlin described the analogous chloride complex as intermediate between these limiting geometries.55 Both coordination geometries are capable of affording a twisted ligand conformation and thus an ECCD spectrum.56
Figure 1.
Two different views of copper complex 1. Displacement ellipsoids are scaled to 50% probability, and counterions omitted for clarity.
The chromophores are tilted, as can be seen from the two views provided in Figure 1. The solid state structure alternates between the two different helicities in the achiral C2/c space group. However, upon complexation with a chiral guest in solution, it was expected that one twist would predominate and thus generate a detectable CD signal.
3) CD Analysis
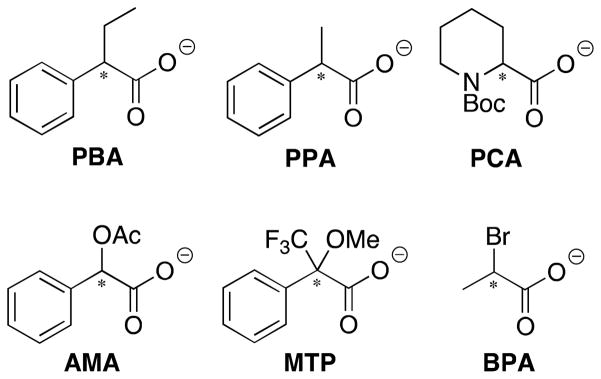
Achiral host 1 alone does not give a signal in the CD spectrum (Figure 2). Additionally, no signals are observed at longer wavelength than 230 nm for any of the chiral carboxylate guests that were chosen for this study (Scheme 1). Further, when the chiral guests were added to a solution containing only Cu(ClO4)2, an absence of signals was also noted. Any signal observed above 230 nm is therefore produced by the formation of a complex between host 1 and a chiral carboxylate guest. For example, the association between host 1 and chiral guest PBA was studied to determine whether or not a helical twist would be imparted on the complex. The CD spectrum was recorded with two equivalents of PBA relative to host 1 in HEPES buffer (75% acetonitrile, 25% water) at pH=7.4, and hence the carboxylate is the dominant species. The addition of the analyte produced a CD couplet indicative of ECCD, with a λmax for the first Cotton effect (CE) occurring at 238 nm (Figure 2), and the second CE at 227 nm. The λmax in the isotropic UV spectrum occurs at 233 nm, near the null in the CD spectrum and consistent with the ECCD assignment. The first CE will be used to represent the observed signal. As can be seen in Figure 2, the (R)- enantiomer of PBA gave a negative CD couplet, while the (S)- enantiomer gave a positive couplet. These are indicative of P-type and M-type propeller twists, respectively.57 The exciton chirality assignment involves the evaluation of the orientation of the transition dipole moments for the two quinoline chormophores.57 Drawing an arc from the vector nearest the viewer towards the one further away gives a positive chirality assignment, which corresponds to a positive couplet in the ECCD spectrum. Thus in these structures an M propeller will give a positive ECCD couplet. These spectra confirmed that enantiomeric complexes are formed, where the stereocenter of PBA determines the twist of the two quinoline substituents in complex 1.
Figure 2.
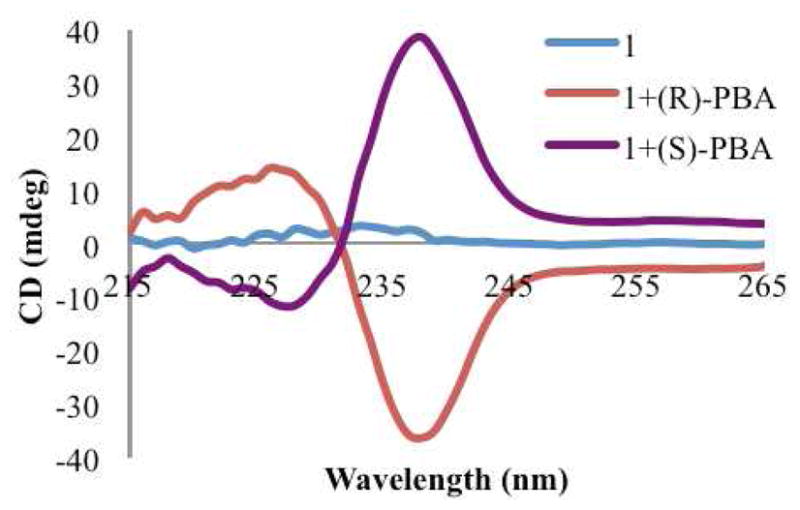
CD spectra of host 1 (0.5 mM) by itself, and with each enantiomer of PBA (1.0 mM) in default buffer (75% MeCN/H2O with 20 mM HEPES buffer at pH=7.4).
Scheme 1.
Chiral guests: 2-phenylbutyric acetate (PBA), 2-phenylpropionic acetate (PPA), O-acetylmandelic acetate (AMA), α-methoxy-α-trifluoromethylphenyl acetate (MTP), 2-bromopropionic acetate (BPA), and 1-(tert-butoxycarbonyl)-2-piperidinecarboxylate (PCA) that were used in this study.
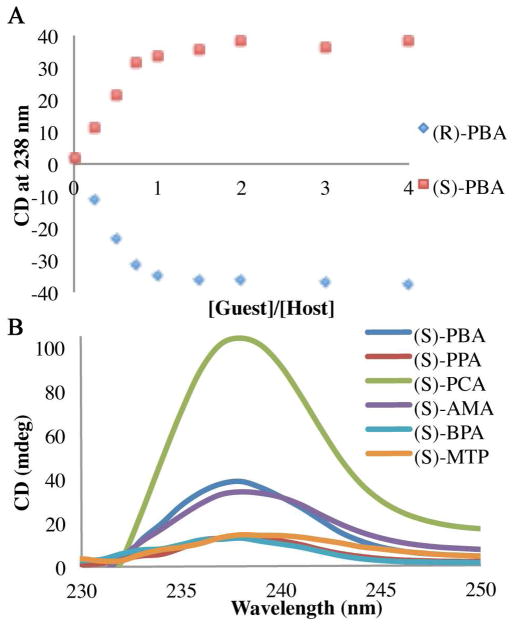
The titration of each enantiomer of PBA into host 1 showed saturation of the CD signal when one equivalent of guest had been added (Figure 3A). Quantification of this binding proved problematic, as necessary dilution diminished the observed CD signals. The difference in the size of the groups attached to the stereocenter were postulated to affect the magnitude of the CD signal. Hence, each enantiomer of every guest was added to the host and the CD signal was recorded. Two equivalents of each guest were used to ensure that host saturation had been reached, and thereby the signal would no longer have a concentration dependence. As expected, the CD spectra were unique for each guest. All of the (S)-enantiomers showed the same positive first CE, with the only variance being the magnitude and shape of the curve (Figure 3B). In addition, each enantiomer of guest gave a CD spectrum that was a mirror image of the other. The configuration of the stereocenter can be assigned based on the sign of the first CD, where all (R)-stereocenters gave a negative signal and the (S)-stereocenters a positive signal. Because both the magnitude and shape of the curves varied, we postulated that the identity of the carboxylates could be differentiated with pattern recognition protocols.
Figure 3.
(A) Change in the CD signal at 238 nm with increasing concentration of indicated enantiomer of PBA (0–2 mM) in host 1 (0.5 mM) in default buffer. (B) CD spectra of host 1 (0.5 mM) with the (S)-enantiomer of each guest (1.0 mM) in default buffer.
4) CD Data Analyses
In order to determine the identity of the chiral carboxylates, linear discriminant analysis (LDA) was applied as a statistical analysis technique.58,59 LDA creates functions based on the input data with the purpose of maximizing the distance between classes of analytes while minimizing the separation of individual points within a single analyte class. LDA is known as a supervised technique because the identity of each data point is known when the data are input. To this end, five repetitions were recorded for each enantiomer of each guest with two equivalents of guest added relative to host 1, making up a total of 70 samples (Figure 4). The CD signals between 235 and 265 nm recorded at 1 nm intervals were analyzed. These wavelengths were chosen because they represent the region of the CD spectrum that changes the most with addition of guest, omitting the shorter wavelength that may change slightly from the phenyl rings of some of the carboxylate guests.
Figure 4.
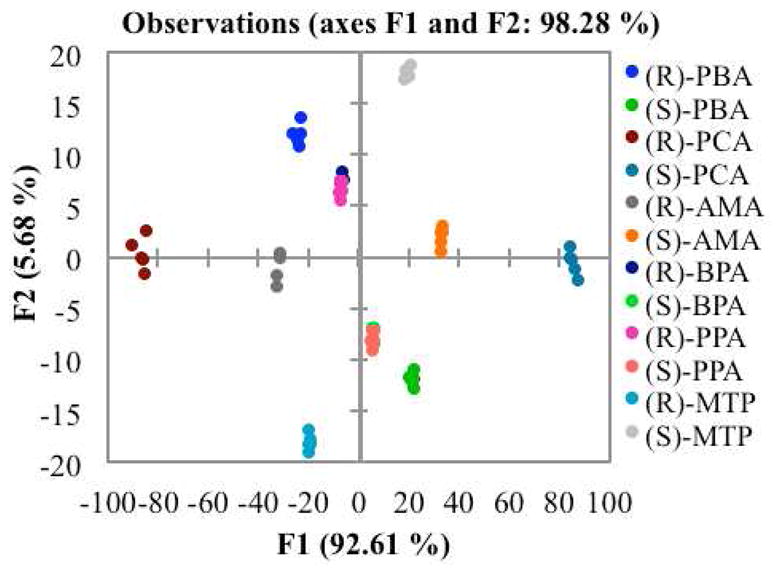
Two-dimensional LDA plot depicting the response of host 1 to each carboxylate guest.
The LDA plot showed good discrimination of the carboxylate guests, with the exception of PPA and BPA. The greatest axis of differentiation, F1, corresponds to the configuration of the stereocenter. All of the (R)-enantiomers show up on the negative side of the plot, with the (S)-enantiomers on the positive. The values on the F1 axis furthest from zero represent the largest CD signals, while those closest represent the smallest signals. The enantiomers of each guest are reflected through the origin onto each other. The second axis of differentiation, F2, represents a much smaller amount of sample variance. This variance is attributed to the shape of the curves, because there are points where the CD spectra cross each other (Figure 3B).
The predictive power of the plot was determined through a leave-one-out technique, known as a jack-knife analysis. This method omits a single data point and creates a new set of functions in its absence. The point is then assigned to a group based on these new functions, with its successful placement representing the validity of the plot. This is repeated for each data point, and a percentage is calculated. This particular LDA plot gave a 98.25% jack-knife analysis, indicating that it is very successful in assigning the identity of the carboxylates.
The most important factor for discriminating the identity of the guests is the magnitude of the CD signal. A larger signal rises from a larger twist between the quinoline groups assembled around the copper metal center. A Newman projection of host 1 with PBA bound was created for this system looking down the tertiary amine nitrogen to copper bond, similar to the crystal structure shown in Figure 1B. This orientation allows for facile visualization of the propeller twist (Figure 5). Thus, the front atom of the Newman projection is the tertiary nitrogen atom of the ligand. The view down the Newman projection represents a linear arrangement of this tertiary amine, metal center, followed by the circle showing the carboxylate, and lastly the α-carbon to the carboxylate group (Figure S11).
Figure 5.
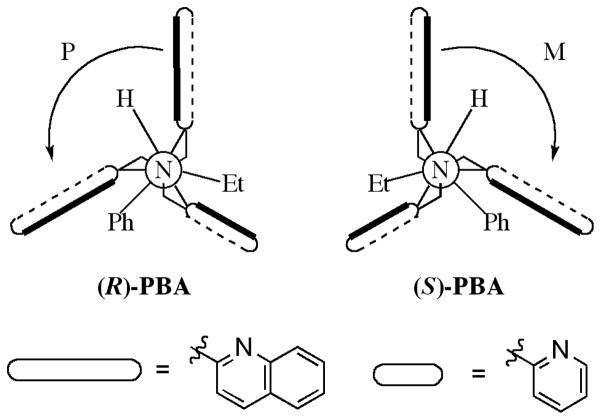
Newman projections for host 1 with each enantiomer of PBA bound. An M-propeller gives – chirality for the orientation of the quinoline electronic dipole moments.
Using this Newman projection as a model, we constructed a rationalization of the CD spectra as follows. In the absence of a chiral guest, the complex exists in two enantiomeric propeller-like conformations, with the propeller formed by the planes of the heterocycles. Upon forming a complex, the guest minimizes steric interactions with the host with the smallest substituent on the stereocenter, hydrogen, placed between the quinoline groups. The proximity of the medium and large groups near the chromophores biases adoption of a particular propeller conformation, with the orientation of the stereocenter determining the direction of the twist. Thus, the (R)- enantiomer leads to an M-type propeller, while the (S)- enantiomer prefers a P-type propeller (Figure 5). This model accurately predicts the helicity that is observed for homochiral carboxylate guests. The varying intensities of CD signals for different complexes may be affected by several factors, although specific steric interactions between the quinolines and groups attached to the carboxylate chiral center appear to play a dominant role.
In order to test that steric size of the substituents on the stereocenter is the cause of the sign of the CD signal, we expanded the scope of the study to include guests BMA and CMA (Figure 6A). The homochiral enantiomers of BPA and BMA have the same molecular orientation in space, as designated by the Cahn-Ingold-Prelog (CIP) rules for assigning group priority in stereochemical determination.60 Excluding the carboxylate that is bound to the metal center, the bromine gets the highest priority, followed by the alkyl group, and finally hydrogen. In the case of BPA, the steric size of the groups follows along with these CIP rules. This is not the case, however, considering BMA. The isopropyl group is expected to be larger than bromine, resulting in the opposite configuration when considering steric size.61 Indeed, the observed CD spectrum for (R)-BMA gives a positive first Cotton effect, the opposite of the signal observed for (R)-BPA. (Figure 6B), providing evidence for the steric model that has been proposed. Next, we turned our focus to quantifying the magnitude of the observed signals.
Figure 6.
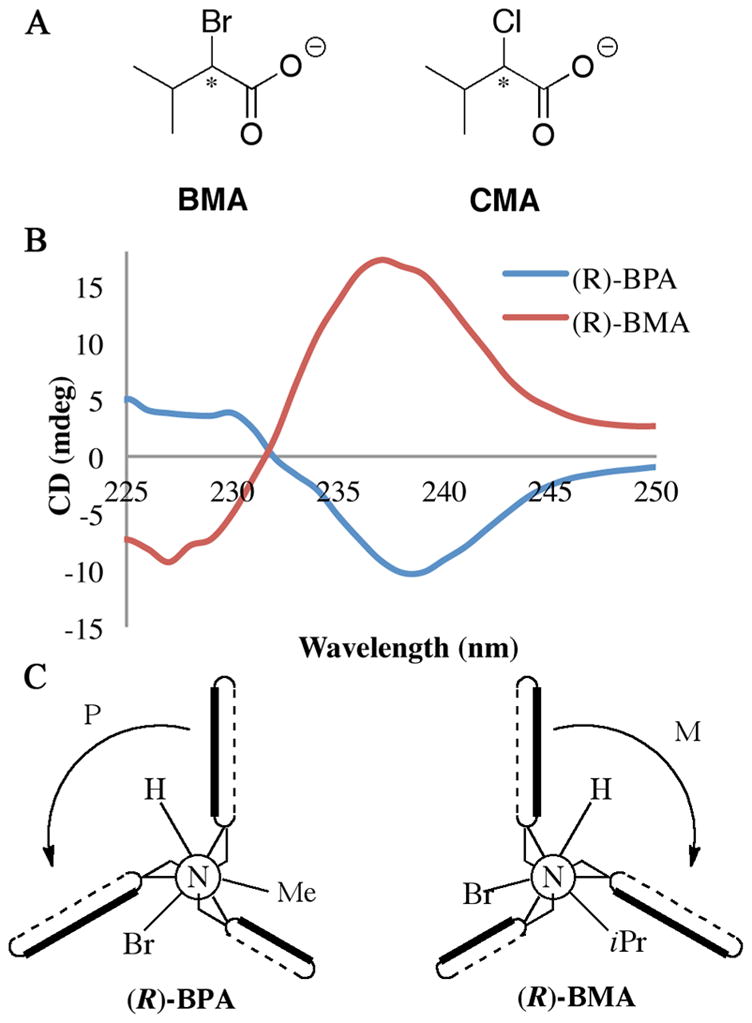
(A) Chemical structures of the additional guests analyzed. (B) CD spectrum of host 1 (0.5 mM) with indicated guest (1.0 mM) in default buffer. (C) Newman projections of host 1 with the (R)-enantiomer of the indicated guest bound.
In order to understand how steric size is related to the size of the observed CD signals, Taft parameters were applied.60 The Taft parameters quantify the steric size of a group by a linear free energy relationship, derived from the study of the acid-catalyzed hydrolysis of an ester (Figure 7). Comparing the rate of hydrolysis for a substrate in question, to the reference reaction where R is hydrogen, gives the steric size of the group by way of the parameter ES. Taft used the acid-catalyzed hydrolysis to elucidate the steric effects in the absence of electronic considerations. He reasoned that the acid-catalyzed reaction was less affected by electronics because the rate determining step, nucleophilic addition to the carbonyl, maintained the same charge throughout. The size of the additional proton is assumed to be negligible, and is present in both structures. In the case of the base-catalyzed reaction, the rate determining step takes a neutral molecule and gives it a negative charge, making this pathway much more susceptible to electronic effects.
Figure 7.
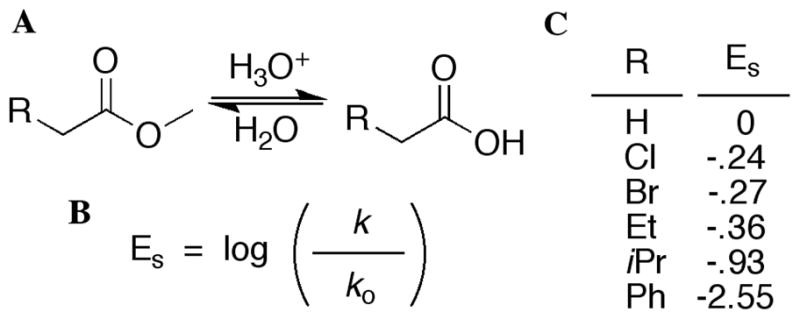
(A) Acid-catalyzed hydrolysis of an ester used by Taft to study steric size. (B) Equation used to calculate group size, known as ES. (C) Taft parameters for selected substituent groups.
Since steric factors were found to be the basis for the sign of the CD signal, these sizes were used to understand the magnitude of the observed signal. The largest group on the carboxylate stereocenter is expected to be pointed in the direction of the pyridine ring, and thus have a more subtle effect on the imparted twist. Therefore, in this model the twist will be governed by the medium and small groups because they will have more of an interaction with the quinoline chromophores, represented pictorially in Figure 5. The guests (PBA, PPA, BPA, BMA, and CMA) that were used for this analysis were selected because the Es values for the relevant substituents on the stereocenter were known. The difference in the Es values between the medium and the smallest groups was plotted against the observed CD signal for the (S)- enantiomers of the guests, and is shown in Figure 8. Because the orientation of the groups in BMA and CMA were reversed, the difference in Es values was expressed as a negative number. The resulting graph is linear, indicating that the magnitude of the CD signal directly varies with the difference in steric size of the substituent groups. It is also important to note that this plot shows an overlap between the two guests PPA and BPA. These were the two guests that were not fully differentiated by the LDA analysis presented earlier, because they gave CD signals that were very similar.
Figure 8.
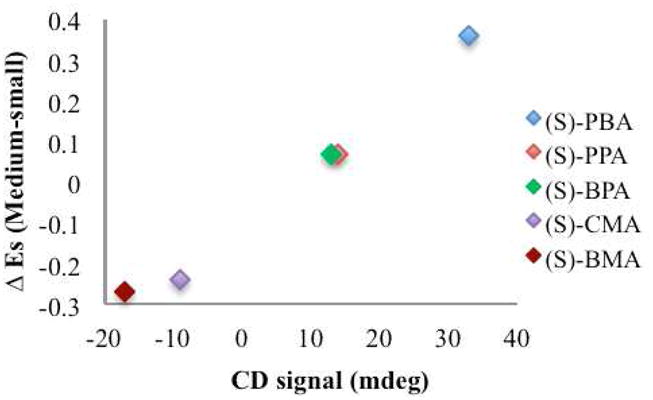
Graph of the CD signal of the (S)-enantiomer of the indicated guest plotted against the difference in the ES values of the medium and small sized groups.
5) Analysis of ee
After determining the identity of the carboxylates and rationalizing the size and magnitude of the observed CD signals, our focus shifted towards determining ee values. For this task, ee calibration curves were created for three of the carboxylates that were studied. The values for these curves vary between 100 and -100% ee, as it is calculated by [([R]-[S])/([R]+[S])]×100, and hence an ee value of 100% corresponds to only the (R)-enantiomer. The carboxylates studied, PCA, PBA, and PPA, were chosen as they cover a broad range of CD signal amplitudes. To ensure the signal was saturated and free of concentration dependence, two equivalents of total carboxylate was added relative to host 1.
A representative calibration curve for PBA is given in Figure 9. This curve fit a linear regression with R2 = 0.99, and the resulting equation allowed the magnitude of the CD signal to be related to the ee of the solution. Eight unknown solutions of each enantiomeric carboxylate were prepared independent of the samples used for the calibration curves, and their CD spectra recorded. The signal observed at 238 nm was then used to determine ee values, and the average absolute error was calculated (Table 1). The absolute difference between the actual and calculated values of ee is used herein to denote the average error, and was calculated for each analyte studied. While the observed error did vary according to the difference in amplitude between each enantiomer of the guest, with the greatest amplitude giving the lowest error, there was very little difference in error between guests showing the largest and smallest magnitude CD signals. The average error that was found was 3.0% for the guests studied. This error is well within the acceptable range of errors for HTS.3
Figure 9.
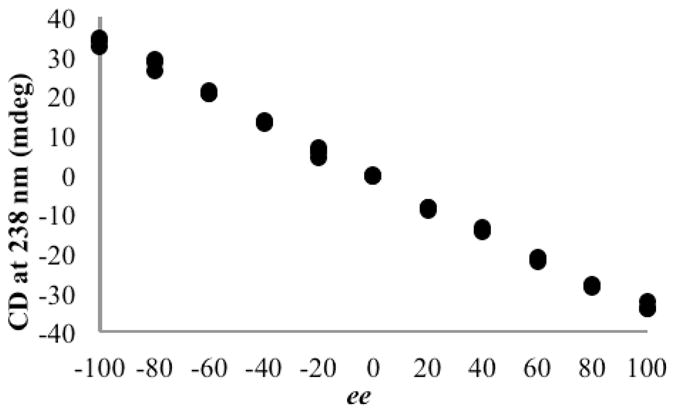
CD signal at 238 nm with varying EE values for a solution of PBA (1.0 mM) and host 1 (0.5 mM) in default buffer.
Table 1.
Errors in ee calculations of unknown guests, as related to ΔCD signal.
| Guest | Avg. Error (%) | ΔCD238 (mdeg) |
|---|---|---|
| PBA | 3.2 | 68.8 |
| PCA | 1.8 | 200.8 |
| PPA | 4.1 | 25.3 |
SUMMARY
In summary, the previously described method used ECCD to determine the absolute configuration of chiral carboxylates. Each enantiomer of a guest gave rise to a mirror image CD spectrum, indicating the formation of enantiomeric complexes. The magnitude of the signal, as well as the shape, allowed for separation of the identities of the carboxylate guests by the pattern recognition protocol LDA. Calibration curves were created for guests using samples of known ee values for three guests. The CD signal of samples of unknown ee value were related by this calibration curve to an ee value, with an average error of 3.0%. The host was easily synthesized, and no extra treatment of the analytes was required. Further studies are currently being undertaken in order to extend the scope of this method, expanding to more elaborate guest structures and moving the stereocenter to more remote locations relative to the carboxylate.
Supplementary Material
Acknowledgments
We thank the National Institutes of Health (GM77437) and the Welch Foundation (F-1151) for financial support, Michelle Adams for making unknown samples, and Professor Adam Urbach and Trinity University for use of the CD spectrometer. JWC thanks the National Science Foundation (CHE-0848234) for financial support.
Footnotes
Supporting Information. Host synthesis, titration data, and unknown ee calculations. This material is available free of charge via the Internet at http://pubs.acs.org
References
- 1.Maruoka K, Ooi T. Chem Rev. 2003;103:3013–3028. doi: 10.1021/cr020020e. [DOI] [PubMed] [Google Scholar]
- 2.Ma L, White PS, Lin WB. J Org Chem. 2002;67:7577–7586. doi: 10.1021/jo0255680. [DOI] [PubMed] [Google Scholar]
- 3.Lee SJ, Lin WB. J Am Chem Soc. 2002;124:4554–4555. doi: 10.1021/ja0256257. [DOI] [PubMed] [Google Scholar]
- 4.Dybtsev DN, Nuzhdin AL, Chun H, Bryliakov KP, Talsi EP, Fedin VP, Kim K. Angew Chem Int Ed. 2006;45:916–920. doi: 10.1002/anie.200503023. [DOI] [PubMed] [Google Scholar]
- 5.Gardimalla HMR, Mandal D, Stevens PD, Yen M, Gao Y. Chem Commun. 2005:4432–4434. doi: 10.1039/b504128g. [DOI] [PubMed] [Google Scholar]
- 6.Terauchi T, Asai N, Yonaga M, Kume T, Akaike A, Sugimoto H. Tetrahedron Lett. 2002;43:3625–3628. [Google Scholar]
- 7.Buck RT, Coe DM, Drysdale MJ, Moody CJ, Pearson ND. Tetrahedron Lett. 1998;39:7181–7184. [Google Scholar]
- 8.Nicolaou KC, Snyder SA. Classics in total synthesis II : more targets, strategies, methods. Wiley-VCH; Weinheim: 2003. [Google Scholar]
- 9.Nicolaou KC, Sorensen EJ. Classics in total synthesis : targets, strategies, methods. VCH; Weinheim; New York: 1996. [Google Scholar]
- 10.Kato D, Mitsuda S, Ohta H. J Org Chem. 2003;68:7234–7242. doi: 10.1021/jo034253x. [DOI] [PubMed] [Google Scholar]
- 11.Groger H. Chem Rev. 2003;103:2795–2827. doi: 10.1021/cr020038p. [DOI] [PubMed] [Google Scholar]
- 12.Reetz MT. Angew Chem Int Ed. 2001;40:284–310. [PubMed] [Google Scholar]
- 13.Bobbitt DR, Linder SW. Trac-Trend Anal Chem. 2001;20:111–123. [Google Scholar]
- 14.Welch CJ, Hyun MH, Kubota T, Schafer W, Bernardoni F, Choi HJ, Wu NJ, Gong XY, Lipshutz B. Chirality. 2008;20:815–819. doi: 10.1002/chir.20548. [DOI] [PubMed] [Google Scholar]
- 15.Thompson R. J Liq Chromatogr. 2005;28:1215–1231. [Google Scholar]
- 16.Schurig V. J Chromatogr A. 2001;906:275–299. doi: 10.1016/s0021-9673(00)00505-7. [DOI] [PubMed] [Google Scholar]
- 17.Wang W, Ma F, Shen X, Zhang C. Tetrahedron: Asymmetry. 2007;18:832–837. [Google Scholar]
- 18.Yang D, Li X, Fan YF, Zhang DW. J Am Chem Soc. 2005;127:7996–7997. doi: 10.1021/ja051072z. [DOI] [PubMed] [Google Scholar]
- 19.Cuevas F, Ballester P, Pericas MA. Org Lett. 2005;7:5485–5487. doi: 10.1021/ol052490b. [DOI] [PubMed] [Google Scholar]
- 20.Superchi S, Bisaccia R, Casarini D, Laurita A, Rosini C. J Am Chem Soc. 2006;128:6893–6902. doi: 10.1021/ja058552a. [DOI] [PubMed] [Google Scholar]
- 21.Qing GY, He YB, Wang F, Qin HJ, Hu CG, Yang X. Eur J Org Chem. 2007:1768–1778. [Google Scholar]
- 22.Mei XF, Wolf C. J Am Chem Soc. 2006;128:13326–13327. doi: 10.1021/ja0636486. [DOI] [PubMed] [Google Scholar]
- 23.Mei XF, Wolf C. J Am Chem Soc. 2004;126:14736–14737. doi: 10.1021/ja0459781. [DOI] [PubMed] [Google Scholar]
- 24.Jadhav VD, Schmidtchen FP. J Org Chem. 2008;73:1077–1087. doi: 10.1021/jo7021026. [DOI] [PubMed] [Google Scholar]
- 25.Walba DM, Eshdat L, Korblova E, Shao RF, Clark NA. Angew Chem Int Ed. 2007;46:1473–1475. doi: 10.1002/anie.200603692. [DOI] [PubMed] [Google Scholar]
- 26.Berova N, Pescitelli G, Petrovic AG, Proni G. Chem Commun. 2009:5958–5980. doi: 10.1039/b909582a. [DOI] [PubMed] [Google Scholar]
- 27.McCormick TM, Wang SI. Inorg Chem. 2008;47:10017–10024. doi: 10.1021/ic801269z. [DOI] [PubMed] [Google Scholar]
- 28.Leung D, Folmer-Andersen JF, Lynch VM, Anslyn EV. J Am Chem Soc. 2008;130:12318–12327. doi: 10.1021/ja803806c. [DOI] [PMC free article] [PubMed] [Google Scholar]
- 29.Zhu L, Zhong ZL, Anslyn EV. J Am Chem Soc. 2005;127:4260–4269. doi: 10.1021/ja0435945. [DOI] [PubMed] [Google Scholar]
- 30.Folmer-Andersen JF, Kitamura M, Anslyn EV. J Am Chem Soc. 2006;128:5652–5653. doi: 10.1021/ja061313i. [DOI] [PubMed] [Google Scholar]
- 31.Nieto S, Lynch VM, Anslyn EV, Kim H, Chin J. Org Lett. 2008;10:5167–5170. doi: 10.1021/ol802085j. [DOI] [PMC free article] [PubMed] [Google Scholar]
- 32.Nieto S, Lynch VM, Anslyn EV, Kim H, Chin J. J Am Chem Soc. 2008;130:9232–9233. doi: 10.1021/ja803443j. [DOI] [PMC free article] [PubMed] [Google Scholar]
- 33.Felten C, Foret F, Minarik M, Goetzinger W, Karger BL. Anal Chem. 2001;73:1449–1454. doi: 10.1021/ac001074w. [DOI] [PubMed] [Google Scholar]
- 34.Reetz MT, Hermes M, Becker MH. Appl Microbiol Biotechnol. 2001;55:531–536. doi: 10.1007/s002530100597. [DOI] [PubMed] [Google Scholar]
- 35.Korbel GA, Lalic G, Shair MD. J Am Chem Soc. 2001;123:361–362. doi: 10.1021/ja0034747. [DOI] [PubMed] [Google Scholar]
- 36.Kacprzak K, Grajewski J, Gawronski J. Tetrahedron: Asymmetry. 2006;17:1332–1336. [Google Scholar]
- 37.Kubo Y, Ishida T, Kobayashi A, James TD. J Mater Chem. 2005;15:2889–2895. [Google Scholar]
- 38.Berova N, Di Bari L, Pescitelli G. Chem Soc Rev. 2007;36:914–931. doi: 10.1039/b515476f. [DOI] [PubMed] [Google Scholar]
- 39.Zhang J, Holmes AE, Sharma A, Brooks NR, Rarig RS, Zubieta J, Canary JW. Chirality. 2003;15:180–189. doi: 10.1002/chir.10158. [DOI] [PubMed] [Google Scholar]
- 40.Holmes AE, Zahn S, Canary JW. Chirality. 2002;14:471–477. doi: 10.1002/chir.10079. [DOI] [PubMed] [Google Scholar]
- 41.Zahn S, Canary JW. Org Lett. 1999;1:861–864. doi: 10.1021/ol990715a. [DOI] [PubMed] [Google Scholar]
- 42.Pfeiffer P, Quehl K, Tappermann F. Ber Dtsch Chem Ges B. 1930;63B:1301–1308. [Google Scholar]
- 43.Canary JW, Mortezaei S, Liang JA. Coord Chem Rev. 2010;254:2249–2266. [Google Scholar]
- 44.Holmes AE, Das D, Canary JW. J Am Chem Soc. 2007;129:1506–1507. doi: 10.1021/ja0666147. [DOI] [PubMed] [Google Scholar]
- 45.Hor K, Gimple O, Schreier P, Humpf HU. J Org Chem. 1998;63:322–325. [Google Scholar]
- 46.Matile S, Berova N, Nakanishi K, Fleischhauer J, Woody RW. J Am Chem Soc. 1996;118:5198–5206. [Google Scholar]
- 47.Matile S, Berova N, Nakanishi K, Novkova S, Philipova I, Blagoev B. J Am Chem Soc. 1995;117:7021–7022. [Google Scholar]
- 48.Yang Q, Olmsted C, Borham B. Org Lett. 2002;4:3423–3426. doi: 10.1021/ol026527t. [DOI] [PubMed] [Google Scholar]
- 49.Tabei J, Shiotsuki M, Sanda F, Masuda T. Macromolecules. 2005;38:9448–9454. [Google Scholar]
- 50.Gawronski J, Grajewski J, Drabowicz J, Mikolajczyk M. J Org Chem. 2003;68:9821–9822. doi: 10.1021/jo030188f. [DOI] [PubMed] [Google Scholar]
- 51.Dalisay DS, Tsukamoto S, Molinski TF. J Nat Prod. 2009;72:353–359. doi: 10.1021/np800549n. [DOI] [PMC free article] [PubMed] [Google Scholar]
- 52.Wei N, Murthy NN, Chen Q, Zubieta J, Karlin KD. Inorg Chem. 1994;33:1953–1965. [Google Scholar]
- 53.Gan W, Jones SB, Reibenspies JH, Hancock RD. Inorg Chim Acta. 2005;358:3958–3966. [Google Scholar]
- 54.Canary JW, Holmes AE, Liu J. Enantiomer. 2001;6:181–188. [PubMed] [Google Scholar]
- 55.Wei N, Murthy NN, Karlin KD. Inorg Chem. 1994;33:6093–6100. [Google Scholar]
- 56.Holmes AE, Simpson SA, Canary JW. Monatsh Chem. 2005;136:461–475. [Google Scholar]
- 57.Castagnetto JM, Xu X, Berova ND, Canary JW. Chirality. 1997;9:616–622. doi: 10.1002/(SICI)1520-636X(1997)9:5/6<616::AID-CHIR32>3.0.CO;2-P. [DOI] [PubMed] [Google Scholar]
- 58.Johnson RAWDW. Applied Multivariate Statistical Analysis. Prentice-Hall; New Jersey: 1982. [Google Scholar]
- 59.Buryak A, Severin K. J Am Chem Soc. 2005;127:3700–3701. doi: 10.1021/ja042363v. [DOI] [PubMed] [Google Scholar]
- 60.Cahn RS, Ingold C, Prelog V. Angew Chem, Int Ed Engl. 1966;5:385–415. [Google Scholar]
- 61.Taft RW., Jr Steric effects in organic chemistry. 1956:556–675. [Google Scholar]
Associated Data
This section collects any data citations, data availability statements, or supplementary materials included in this article.


