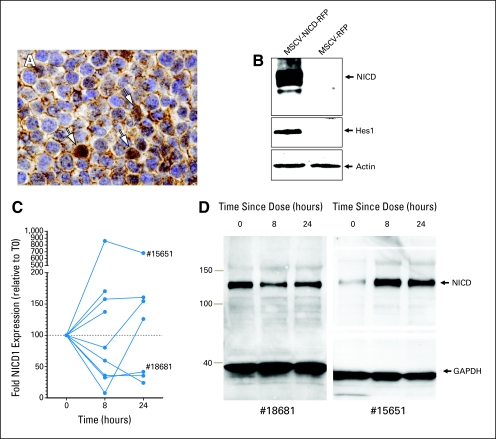
Fig 1.
NOTCH pathway expression in patient tumors and peripheral-blood mononuclear cells. (A) NICD1 expression in choroid plexus carcinoma nuclei (arrows). (B) NICD1 Western blot analysis validation following cell transduction with human NICD1 virus (left lane) and control (right). Note hairy enhancer of split 1 (Hes1) induction. (C) Graph of fold change in NICD1 levels post treatment. (D) Western blot results in two patients (#18681 and #15651). GAPDH, glyceraldehyde 3-phosphate dehydrogenase; MSCV-NICD-RFP, mouse stem cell virus—NOTCH1 intracellular domain—red fluorescence protein.

