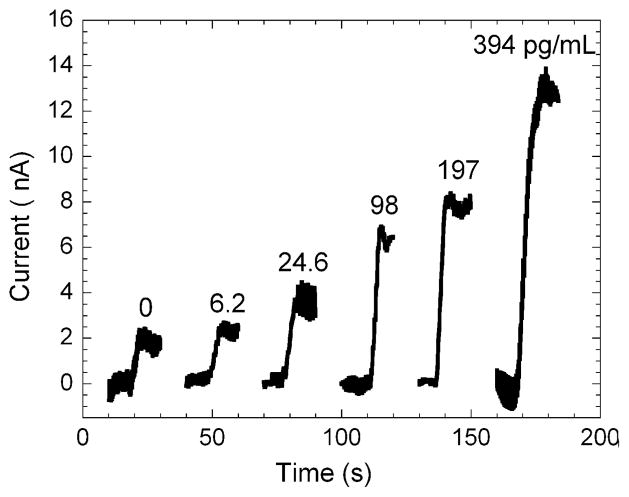
Fig. 6.
Representative amperograms of immunosensors for IL-6 in undiluted calf serum represented as three-second moving averages of the raw reduction current sampled every 0.1 s for the gold nanoparticle array in pH 7 buffer containing 1 mM hydroquinone. Each plot shows the current increase of a single electrode upon injection of hydrogen peroxide on individual arrays. The average current for each electrode was measured upon reaching a steady state and the current increases were averaged for each concentration to generate the calibration curve (Fig. 7). This calibration curve shows that the current increased linearly from 6 to 394 pg mL−1. Immunoarray sensitivity from the slope of the calibration curve was 11.4 nA pg−1 cm−2 for IL-6 with a detection limit of 20 pg mL−1. The detection limit was estimated from the calibration curve as 3 standard deviations larger than the 0 pg mL−1 response. The standard deviations of the current increased at the higher concentrations as the immunosensors approached surface saturation.

