
Figure 6.
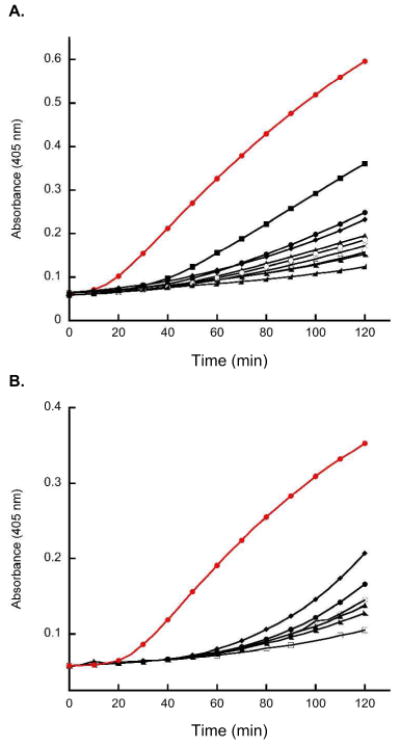
Representative plots from inner-membrane permeabilization assays. ONP formation monitored at 405 nm following incubation of E. coli ML35 with 2 μM of peptide and 2.5 mM ONPG at 37 °C (10 mM sodium phosphate buffer, 1% TSB, pH 7.4). (A) Comparison of HD5ox with the Ser mutant peptides. (red ●) HD5ox, (●) HD5[Ser3,31]ox (5-20)(10-30), (◣) HD5[Ser3,31]ox (5-30)(10-20), (◆) HD5[Ser3,31]ox (5-10)(20-30), (▲) HD5[Ser10,30]ox (3-20)(5-31), (■) HD5[Ser5,20]ox (3-31)(10-30), (◢) HD5[Ser5,20]ox (3-30)(10-31), (○) HD5[Ser10,30]ox (3-31)(5-20), (×) HD5[Serhexa]. (B) Comparison of HD5ox with the Ala mutant peptides. (red ●) HD5ox, (●) HD5[Ala3,31]ox (5-20)(10-30), (◣) HD5[Ala3,31]ox (5-30)(10-20), (◆) HD5[Ala3,31]ox (5-10)(20-30), (▲) HD5[Ala10,30]ox (3-20)(5-31), (○) HD5[Ala10,30]ox (3-31)(5-20). Results from inner-membrane permeabilization assays where E. coli ML35 were treated with varying concentrations of each peptide are available as Supporting Information.