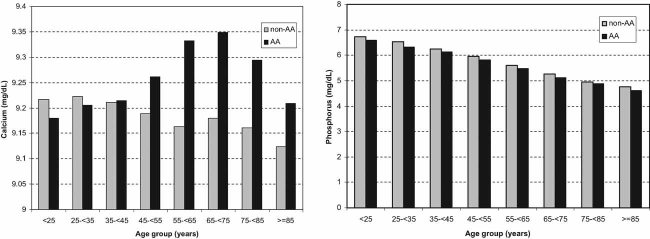
Fig. 1.
Comparing 3-month average serum calcium (left panel) and phosphorus (right panel) concentrations in the base calendar quarter across eight 10-year age increments in 139,328 hemodialysis patients including 43,974 African Americans (32%) and 95,354 non-African Americans (68%) from July 2001 to June 2001.

