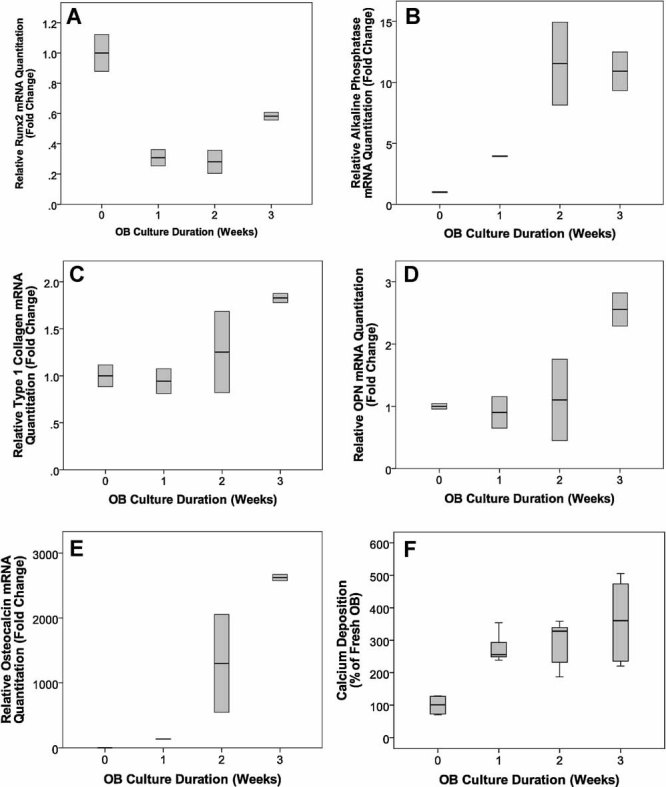
Fig. 5.

Characterization of mRNA expression and calcium deposition in OB cultures (7 days following experiment initiation) from freshly prepared OBs or OBs cultured for 1, 2, or 3 weeks prior to experiment initiation. It should be noted that for all (A–E) gene expression data and (F) calcium deposition data, levels were normalized to levels measured in cultures of fresh OBs. Results are reported as box plots representing the range of data points, with the line representing the average. Error bars represent the standard deviations associated with the mean (all error bars are graphed and in some cases the error bars are within the box plots). There were no data points more than 2 standard deviations from the mean. (A) Runx2 expression was highest in freshly isolated OBs and declined with culture duration. (B) Alkaline phosphatase expression increased with culture duration, peaking at week 2, and this level was maintained in week 3 cultures. As expected, expression of (C) type I collagen, (D) osteopontin, and (E) osteocalcin, as well as (F) calcium deposition, increased as OB culture duration increased.
