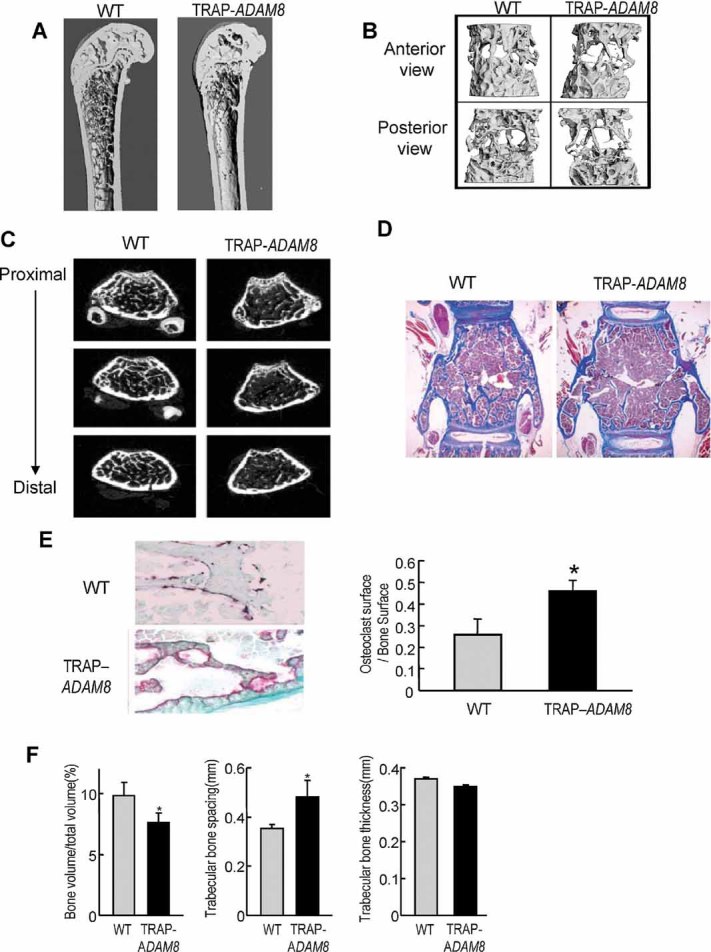
Fig. 2.

Characterization of bones from ADAM8 transgenic mice. (A) Quantitative µCT analysis of trabecular areas of the femurs at 30-week-old mice. (B) Quantitative µCT analysis of the fifth lumbar vertebrae at 30-week-old mice (anteroposterior view). (C) Quantitative µCT analysis of the fifth lumbar vertebrae for 30-week-old mice (proximal-distal view). (D) Histologic features of a TRAP-ADAM8 mouse compared with a WT control mouse at 20 weeks of age. TRAP staining, counterstained with methyl green–thionin. Original magnification ×100. (E) Osteoblast surface/bone surface n = 5 mice per group. *Significant differences (p < .05) between TRAP-ADAM8 and WT mice by Mann-Whitney test. Data represent results from a typical experiment. Similar results were seen in three independent experiments. *p < .05 compared with WT mice. (F) Quantitation of µCT analysis of the fifth lumbar vertebrae from 30-week-old WT and TRAP-ADAM8 mice. The percent bone volume per total volume, trabecular bone spacing (mm), and trabecular bone thickness (2 mm) are shown. Data represent mean values ± SEM for 15 mice per group, significantly different from WT mice by Mann-Whitney test, p < .05.
