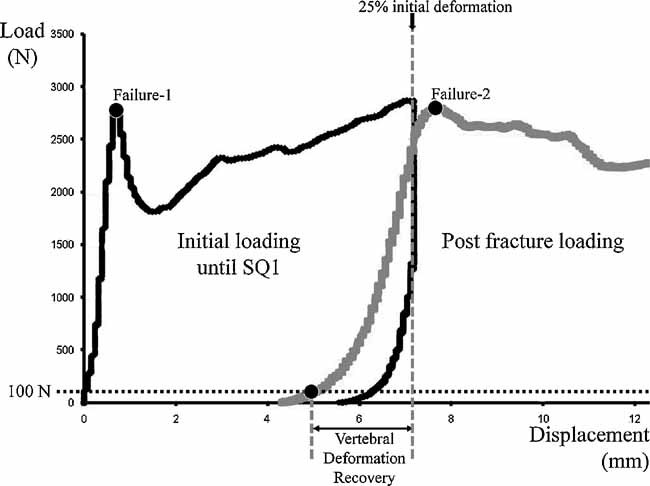
Fig. 1.

Load-displacement curves of an L3 vertebra. The black curve corresponds to the initial mechanical test performed with an initial loading until SQ1 fracture (25% deformation). The gray curve corresponds to the postfracture mechanical test performed after a 30-minute period of relaxation. Vertebral deformation recovery (VDR, %) corresponds to the height recovery with regard to the initial height. Failure 1 corresponds to the initial failure load and failure 2 to the postfracture failure load.
