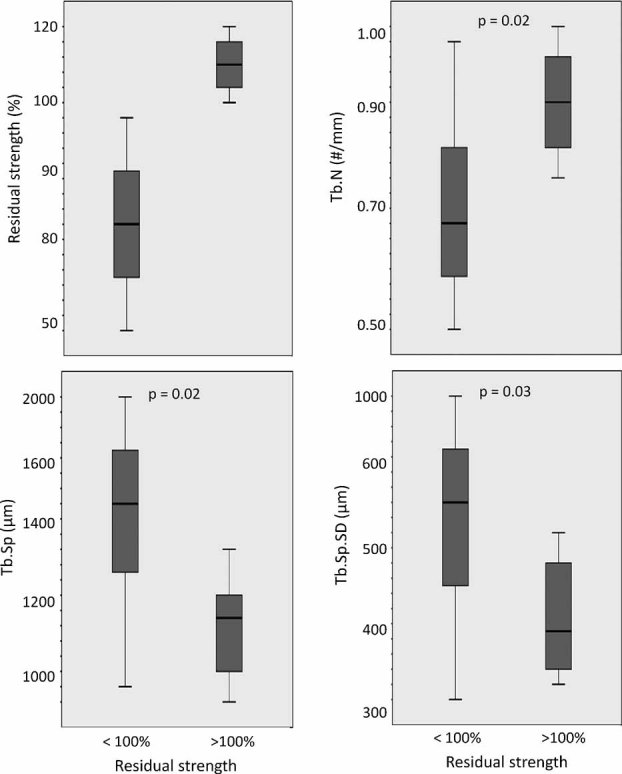
Fig. 4.

Box-plot representations of differences between vertebrae with residual strength <100% (decrease in postfracture failure load) and >100% (increase in postfracture failure load) (minimum value, lower quartile, median, upper quartile, and maximum value). The comparisons between the two groups were performed using Mann-Whitney tests.
