
Fig. 1.
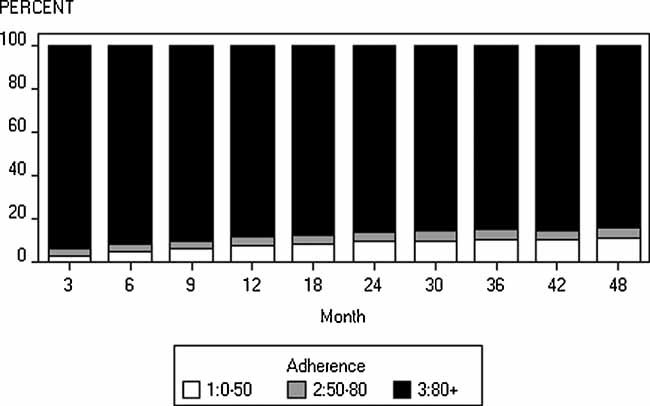
Compliance over the course of FIT. Data shown are the percent of women compliant at each time point.
Official websites use .gov
A
.gov website belongs to an official
government organization in the United States.
Secure .gov websites use HTTPS
A lock (
) or https:// means you've safely
connected to the .gov website. Share sensitive
information only on official, secure websites.
Compliance over the course of FIT. Data shown are the percent of women compliant at each time point.