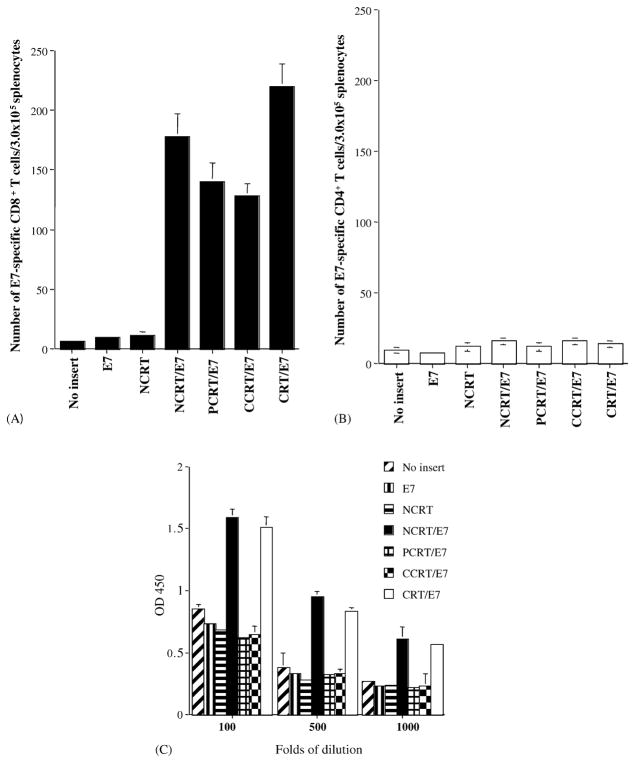
Fig. 2.
Immunological profile of vaccinated mice using intracellular cytokine staining and flow cytometry analysis and ELISA. Mice were vaccinated with DNA encoding no insert, E7, NCRT, NCRT/E7, CCRT/E7, PCRT/E7, or CRT/E7. Splenocytes from vaccinated mice were harvested 7 days after vaccination, cultured in vitro with MHC class I-restricted (aa 49–57) or class II-restricted (aa 30–67) E7 peptide overnight, and stained for intracellular IFN-γ and CD4 or CD8. (A) Bar graph depicting the number of antigen specific IFN-γ-secreting CD8+ T cell precursors/3 × 105 splenocytes (mean ± S.D.). (B) Bar graph depicting the number of antigen specific IFN-γ-secreting CD4+ T cell precursors/3 × 105 splenocytes (mean ± S.D.). Note: Mice vaccinated with CRT/E7, NCRT/E7, PCRT/E7, or CCRT/E7 DNA generated higher numbers of E7-specific IFN-γ-secreting CD8+ T cell precursors than the other vaccination groups. (C) Bar graph demonstrating E7-specific antibodies in mice vaccinated with various DNA vaccines. The results from the 1:100, 1:500, and 1:1,000 dilution are presented, showing mean absorbance (OD450 nm) ± S.D. All data above are from one representative experiment of two performed. Note: NCRT/E7 DNA and CRT/E7 vaccines generated significantly higher E7-specific antibody responses when compared with mice vaccinated with the other DNA vaccines (P < 0.01, one-way ANOVA).

