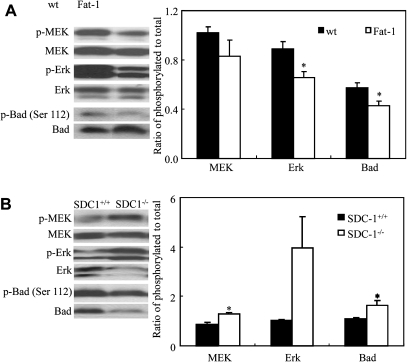
Fig. 5.
Levels of phosphorylated MEK, Erk and Bad in mammary glands of Fat-1 and SDC-1−/− mice. Levels of phosphorylated (p) to total MEK, Erk and Bad in mammary glands of (A) female Fat-1 and wt mice; (B) female SDC-1−/− mice and SDC+/+mice measured by western analysis of tissue extracts. A representative blot for each protein is shown. Data are means ± standard errors of five Fat-1 or three SDC-1−/− mice. Values with asterisk are significantly different from control (P < 0.05).

