
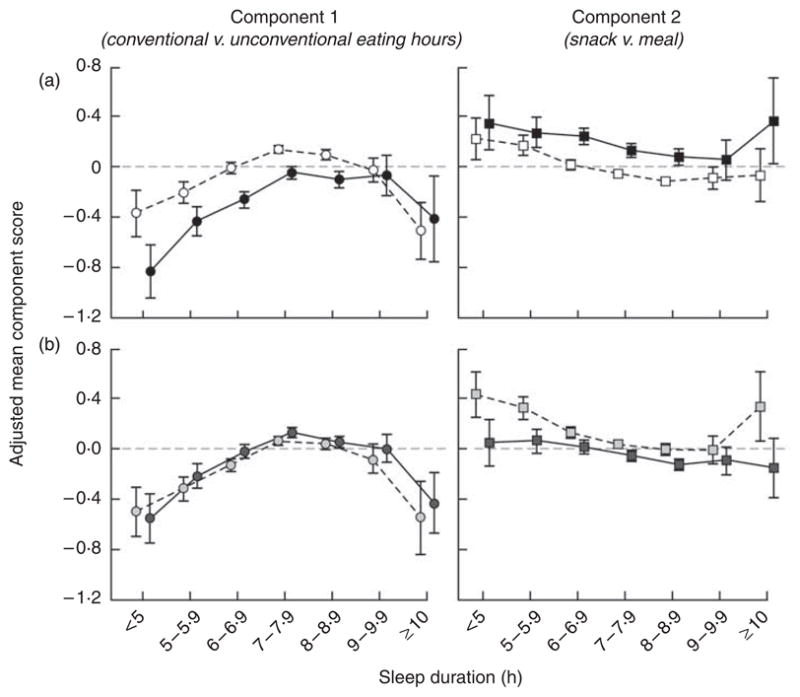
Fig. 2.
Adjusted mean component scores for eating patterns by sleep duration, according to obesity (○, □, BMI<30 kg/m2; ●, ■, BMI≥30 kg/m2) and age (
 ,
,
 , <55 years;
 ,
,
 , ≥55 years) among 27 983 women aged 35–74 years in the Sister Study, 2003–2007. Each circle represents adjusted mean score for eating during conventional eating hours and each square represents adjusted mean score for snacking by daily sleep duration category, estimated from multivariable generalized linear models including age, race, household income, education, marital status, having children <18 years old, smoking status, current alcohol use, menopausal status, self-rated health, perceived level of stress, physical activity and measured BMI. 95% confidence intervals represented by vertical bars. (a) The relationship between sleep duration and eating patterns did not vary by obesity (P=0·13 for component 1 and P=0·65 for component 2, likelihood ratio test); (b) the association between sleep duration and eating during conventional hours did not vary by age (P=0·53, likelihood ratio test), but the association between sleep duration and snack dominance eating pattern was stronger in women aged <55 years than among women aged ≥55 years (P=0·02, likelihood ratio test)