Figure 3.

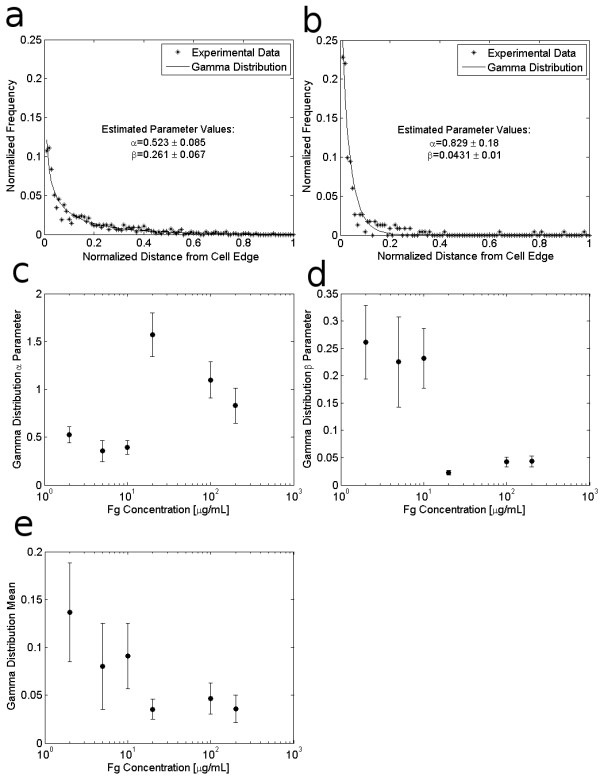
Effect of Fg concentration on integrin cluster distance from cell edge. Integrin cluster location is measured as the distance of each cluster from the cell edge, normalized by the distance from the cell center to the cell edge. Two example frequency distributions and estimated gamma probability distribution functions for integrin clusters > 0.5 μm2 are shown for cells adhering to: (a) 2 μg/mL Fg, and (b) 200 μg/mL Fg. The gamma distribution parameters α and β which were determined by least squares fitting of the gamma distributions to the frequency distributions of locations of integrin clusters in cells adhering to 2-200 μg/mL Fg, are shown in (c) and (d) along with 95% confidence intervals on the parameter estimates. (e) shows the calculated expected (mean) value for the distribution of integrin cluster location in cells adhering to each Fg concentration.
