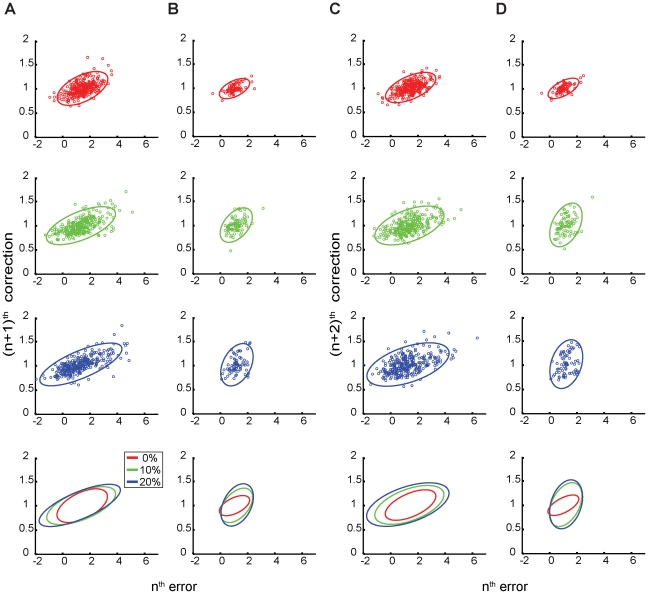
Figure 2. Trial-by-trial error corrections in the stimulus variability task.
A: Predictive-saccade data from one representative subject during Task 1, reflecting corrections to errors made on the very next primary saccade (the (n+1)th saccade, or, in the case of catch trials, the return saccade from the displaced target). B: Reactive-saccade data from one subject in the control for Task 1, for the (n+1)th correction. In C and D, the same time series are used to plot the corresponding predictive-saccade and reactive-saccade error corrections made on the (n+2)th saccade, or the next saccade made in the same direction as the current saccade. In all cases, the top three panels show data from the three stimulus-variability conditions (from top to bottom, the 0% catch-trial, 10% catch-trial, and 20% catch-trial conditions); the bottom panel shows the superimposed CE95 ellipses from the top three plots for comparison purposes.

