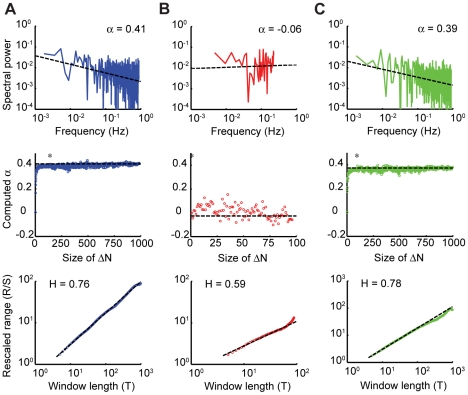
Figure 5. Analysis of long-memory processes.
Predictive-saccade data from one representative subject in Task 2 (A) is compared against a short sequence of reactive-saccade data (B). The same analyses were also applied to simulation data from an ARFIMA(0,d,0) process (C). In all cases, the top panel is the power spectrum of the data plotted on a log-log scale, with the measured α value reported. The middle panel is the bootstrap analysis, demonstrating the change in the value of α from random (near zero) to its measured value (reported in the top panel) as the shuffling-block size, ΔN, is varied. The first point at which the value of α is no longer significantly different from the value measured in the top panel is indicated by (*). The bottom panel displays the result of the Hurst rescaled-range analysis, the slope of which is used to estimate the H parameter. Whereas the predictive-saccade data and the simulation data exhibit long memory, the reactive-saccade data do not.

