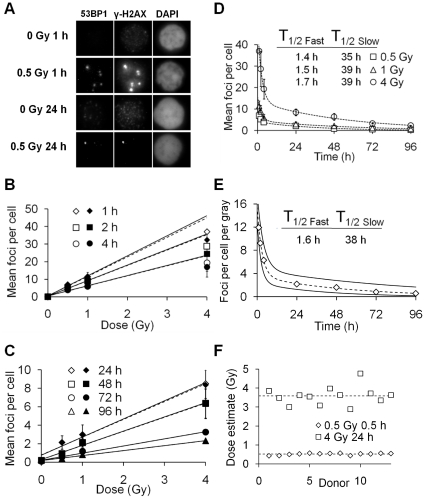
Figure 1. γ-H2AX (open symbols) and 53BP1 (closed symbols) foci induction and loss after uniform exposure to X-rays, detected by immunofluorescence microscopy.
(A) Grey scale immunofluorescent images of 53BP1, γ-H2AX and DAPI in irradiated lymphocytes and controls. Each image is 8.4×7.6 µm in size. (B) Mean γ-H2AX and 53BP1 foci observed between 1–4 hours post exposure. Linear regressions (solid lines for γ-H2AX, dashed for 53BP1) were fitted excluding the 4 Gy data points due to underscoring of foci. (C) Mean γ-H2AX and 53BP1 foci observed between 24–96 hours post exposure. Linear regressions (solid for γ-H2AX, dashed for 53BP1) are fitted to all data points. (D) γ-H2AX foci loss over 96 hours. Dashed lines represent bi-exponential fits for γ-H2AX loss for each dose. T1/2 Fast and T1/2 Slow represent the individual half-lives of the two exponentials. (E) γ-H2AX foci yields per cell per gray between 1–96 hours calculated using linear regression coefficients of γ-H2AX foci counts from Figures 1B and 1C. The dashed line represents a bi-exponential fit for mean γ-H2AX loss per unit dose and solid lines the upper and lower 95% confidence limits. (F) Dose estimates in X-irradiated lymphocytes from 13 healthy donors. γ-H2AX foci were scored and the dose estimated using the calibration curve from Figure 1E. The dashed lines represent the average dose estimates based on all the donors.

