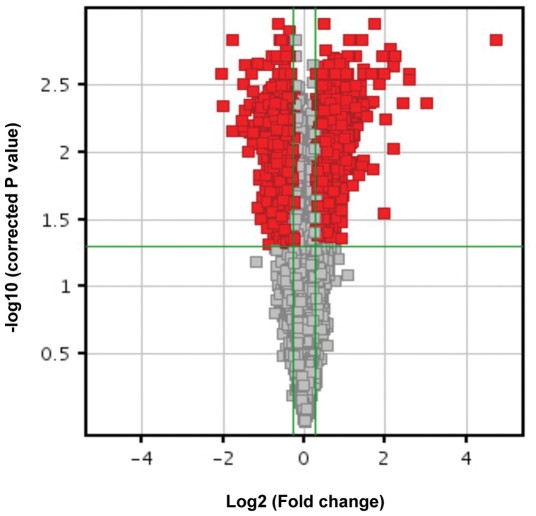
Figure 1. Volcano plot representation of dysregulated genes.
One way ANOVA test with Benjamini and Hochberg false discovery rate (FDR) correction was applied to the comparison between the conditions (siPax8 vs. controls), using a 0.05 threshold for statistical significance. The negative log10-transformed p-values are plotted against the log ratios (log2 fold change) between conditions. Red dots represent differentially expressed genes that show both large fold changes and high statistical significance. Gray dots represent all the other genes.

