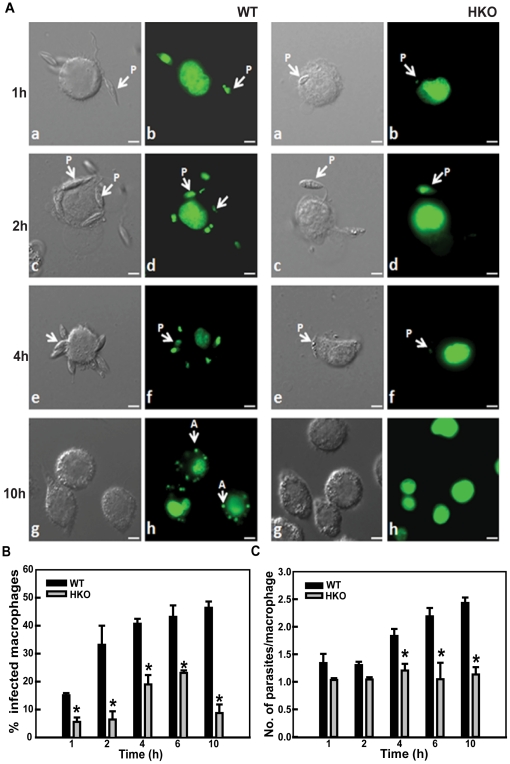
Figure 6. In vitro infective abilities of WT and HKOs.
A. Photomicrographs of macrophage infected with WT and HKO parasites for different time points. b: 1 h; d: 2 h; f: 4 h; h: 10 h; a, c, e, g: nomarski of b, d, f, h respectively. Scale, 5 µm. P: promastigote, A: amastigote. B. Bar graph showing percentages of macrophages infected with WT and HKO parasites. Mean ± SE, n = 3, * P≤0.05. C. Number of parasites present in infected macrophages over a period of time. Mean ± SE, n = 3, * P≤0.05.

