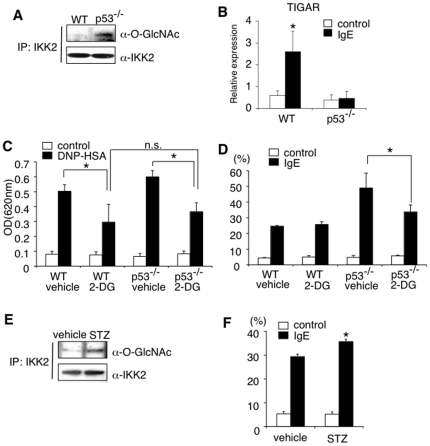
Figure 4. Lack of p53 expression in mast cells results in enhanced O-GlcNAcylation of IKK2.
(A) O-GlcNAcylation of IKK2 in WT or p53−/− BMMCs was detected by immunoprecipitation with anti-IKK2 antibody, followed by immunoblotting with anti-O-GlcNAc antibody. Shown are representative blots from 5 independent experiments. (B) The expression of TIGAR was assessed by Q-PCR analysis as described in Figure 1F . Data are means ± SD, n = 5, *significantly different from the mean value of controls, *p<0.01. (C) 2-deoxy-D-glucose (2-DG) were given to W/Wv mice reconstituted with WT or p53−/− BMMCs. Twenty hours later, PCA reaction was assessed as described in Figure 2C . Data are means ± SD, n = 6 for each, *p<0.05. (D) WT or p53−/− BMMCs were incubated with 2-DG (4.5 mg/ml) for 2 hours. IgE-mediated degranulation was assessed as described in Figure 2D . Data are means ± SD of the percent β-hexosaminidase release, n = 5, *p<0.01. (E) WT BMMCs were incubated with streptozotocin (STZ; 5 mM) or vehicle for 3 hours. O-GlcNAcylation of IKK2 was detected as described in Figure 4A . Shown are representative blots from 5 independent experiments. (F) After incubation with STZ for 3 hours, WT BMMCs were subjected to IgE-mediated degranulation. Data are means ± SD of the percent β-hexosaminidase release, n = 5, *significantly different from the mean value of vehicle, *p<0.05.

