
Figure 4.
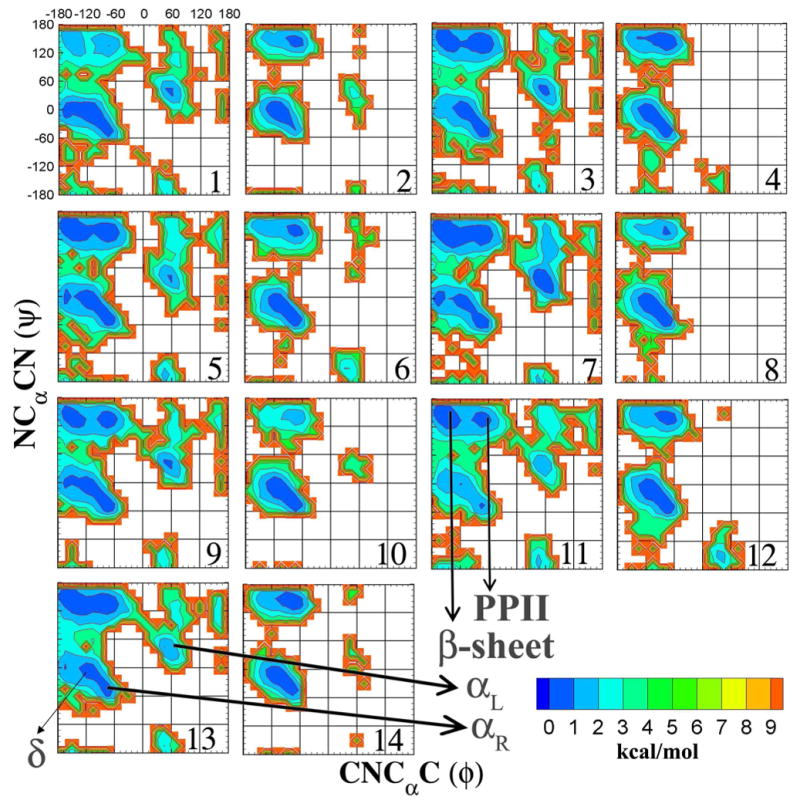
Two-dimensional relative free energy surfaces for ϕ(CNCαC) versus ψ(NCαCN) dihedrals, given in degrees, calculated from HREX simulations for all the model glycopeptide systems. The various significant regions of the ϕ/ψ plot have been labeled. Relative free energies are calculated from the natural logarithm of the relative probability and are given in kcal/mol.