
Figure 9.
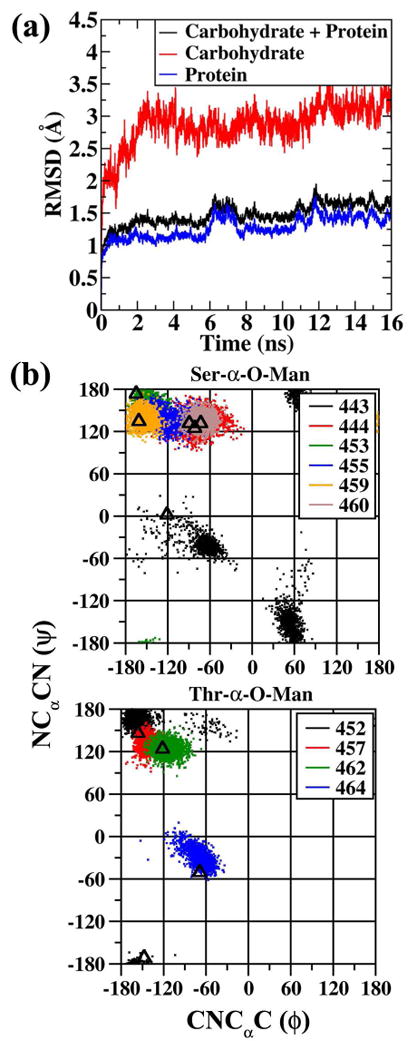
(a) RMSD analysis for the protein 3GLY. RMSD values are for all non-hydrogen atoms following RMS alignment with the crystallographic structure. (b) ϕ(CNCαC) versus ψ(NCαCN) dihedral distribution for the Ser-α-O-Man (upper panel) and Thr-α-O-Man (lower panel) linkages from the last 10 ns of the MD trajectory. Triangles indicate the ϕ/ψ values observed in the crystal structure. Dihedral angles given in degrees.