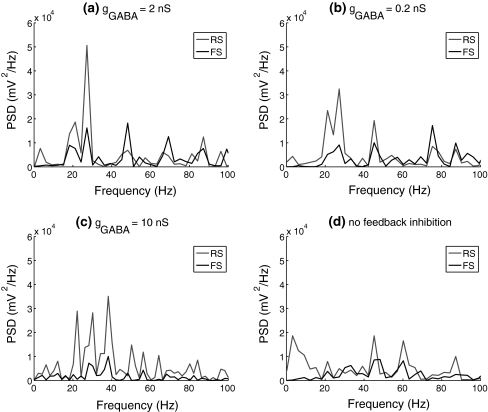
Fig. 11.
Power spectrum density (PSD) of spike trains of the RS and FS cells with different conductance of the inhibitory connections between FS cells. PSD for FS cells is an averaged value calculated from the membrane potentials of the whole FS population. agGABA = 2 nS; bgGABA = 0.2 nS; cgGABA = 10 nS; d no feedback inhibition

