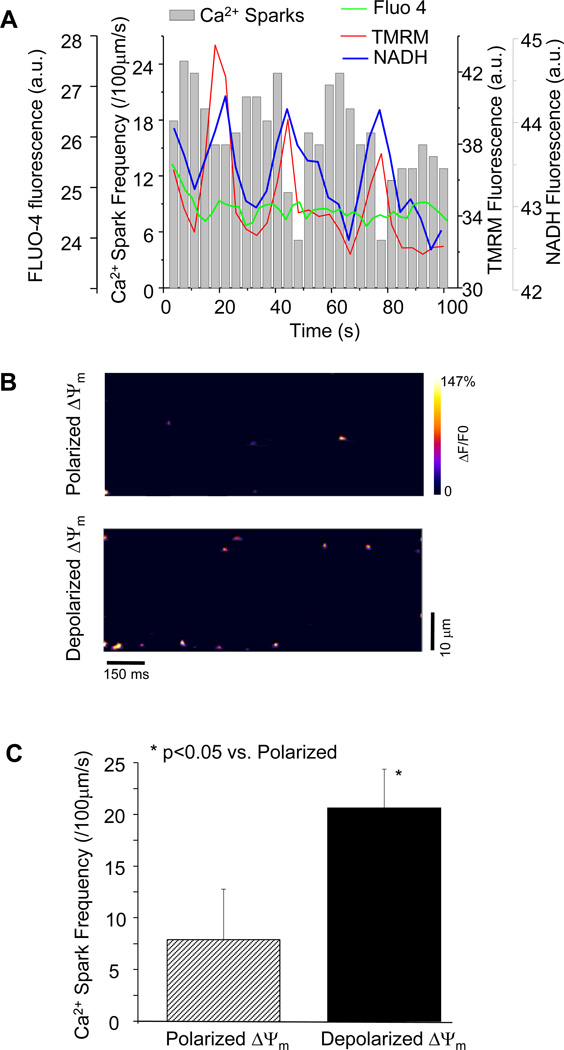
Figure 1.
Influence of oxidative stress on mitochondrial ΔΨm and Ca2+ spark frequency. (A) Phase relationship among oscillations in ΔΨm, NADH, and cyclic changes of Ca2+ sparks as a result of oxidative stress induced by a localized laser flash (a.u.: arbitrary units of fluorescence). The green line indicates Fluo-4 fluorescence intensity that reflects average cytosolic Ca2+; (B) Representative contour plots showing increased Ca2+ spark frequency when mitochondria depolarized; and (C) Quantitative comparison of Ca2+ spark frequency between ΔΨm polarization and depolarization states.

