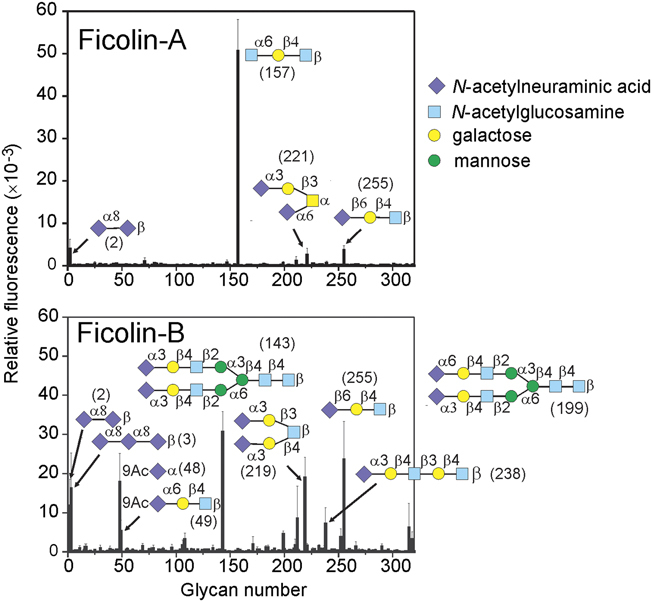
Figure 3.

Glycan array screening of rat ficolins-A and -B. Fluorescently labelled ficolins (200 μg/mL) were used to probe the glycan array comprising 320 ligands. Error bars represent the means±SD of six measurements. Structures of the best glycan ligands are indicated.
