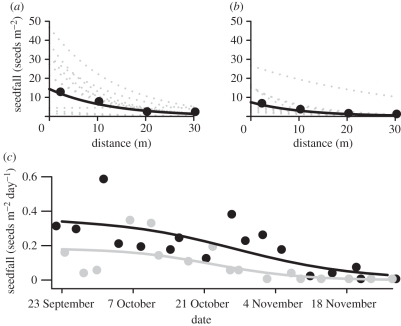
Figure 1.
The relationship between P. malaanonan seedfall and distance from the nearest fruiting tree in (a) unlogged and (b) logged forest. Points are the mean number of seeds falling into 1 m2 seed traps located at 2, 10, 20 and 30 m from 10 trees in each forest type. Solid lines represent the number of seeds predicted to fall at each distance by the model fitted to the data. Dotted lines represent the predictions for each of the 10 trees in each forest type. (c) The majority of seeds fell in the first six weeks of the study. Points are the mean number of seeds that fell in seed traps placed 2 m away from each tree and lines are the model predictions. Black line, unlogged; grey line, logged.

