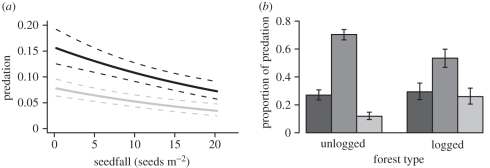
Figure 5.
(a) Insect predation on P. malaanonan seeds collected in traps or from the forest floor nearby was higher in logged forest than unlogged forest and at trees that produced fewer seeds. Lines are the predictions of the models fitted to the data (±s.e.). Black line, unlogged; grey line, logged. (b) The proportion of predated seeds attacked by different predators. Bars represent the mean (±s.e.) proportion of seed predators within three different categories and the proportion of predators that had been parasitized. Dark grey bars, moths; mid-grey bars, weevils; light grey bars, parasitoids.

