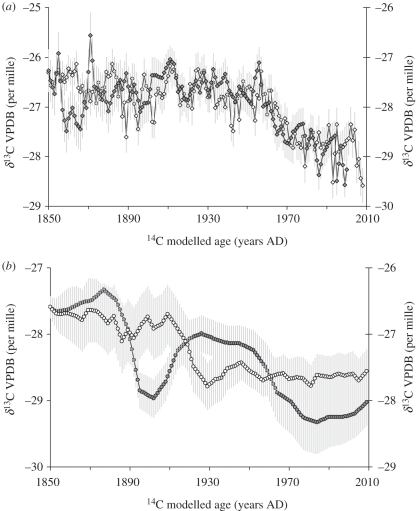
Figure 2.
Graphs showing the raw stable isotope series for the four trees studied at (a) Danum (S. superba and S. johorensis) and (b) Imbak (E. zwageri). Filled diamonds, S. superba; open diamonds, S. johorensis; filled circles, E. zwageri (Tree T6B2); open circles, E. zwageri (Tree T5B1). Grey error bars represent the uncertainty in age–growth model (1 sigma ≈ ±40 years) expressed as the running standard deviation of tree response over a 40 year period.

