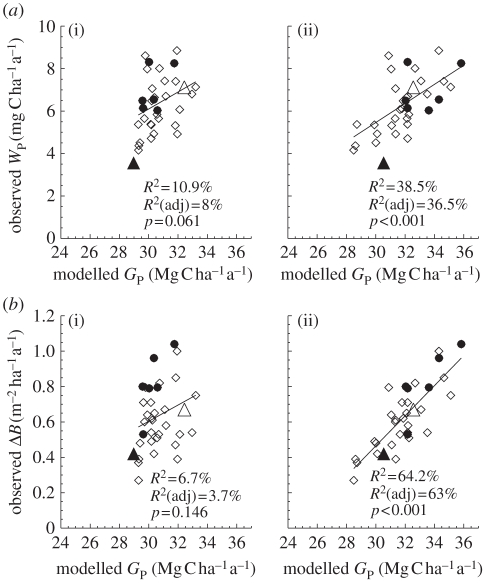
Figure 6.
Relationships of simulated  against (a) observed stem growth (WP) and (b) basal area growth (ΔB) [6] at 33 sites. Model configurations correspond to assumption of (i) N limitation (using [N]A only) and (ii) P limitation (using [P]A only) across all studied sites. Filled and open symbols correspond to N- and P-limited sites, respectively, according to equation (2.2). The triangle symbols correspond to sites with no available soil phosphorous data.

