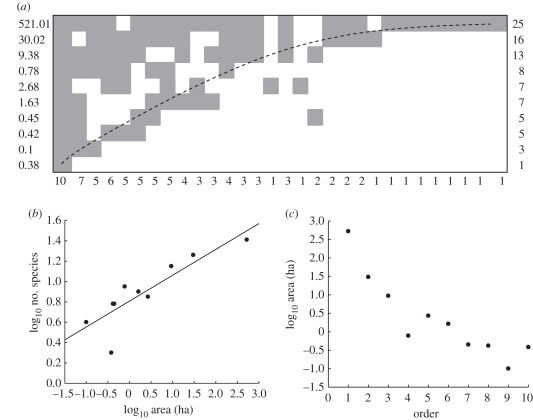
Figure 2.
The types of analyses we carried out on published datasets for birds. Data [88] showed significant patterns of species richness and composition among fragments. (a) Fragments arranged to achieve maximum nestedness of species presences (grey cells) and absences (white cells) in the fragment (rows) × species (columns) matrix. Values to the left of the matrix show fragment areas (ha), all other values show species richness. The matrix was significantly nested (T = 4.48, p < 0.001). (b) SAR fitted by the power function: log10S = log10 0.81 (s.e. ± 0.05) + 0.254 (s.e. ± 0.05) × log10 area. R2 = 0.76, p = 0.001. (c) The order in which fragments were arranged to achieve maximum nestedness was negatively correlated with their area (rs = −0.95, p < 0.001).

