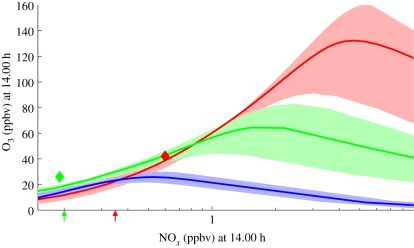
Figure 4.
Ozone response of different VOC emission scenarios, driven by possible land-use change, to a change in NOx, as computed by the CiTTyCAT box model (lines) and the p-TOMCAT model (diamonds, for FOREST and OILPALM2 scenarios, see §4b). Results are plotted at a local time of 14.00 from each model (with the CiTTyCAT model run to a steady diurnal cycle). Typical contemporary forest and oil palm landscape NOx mixing ratios are indicated by the coloured arrows on the x-axis. Green line, rainforest landscape; red line, oil palm landscape; blue line, no BVOC landscape; shading shows effect of ±50% VOC flux on predicted ozone.

