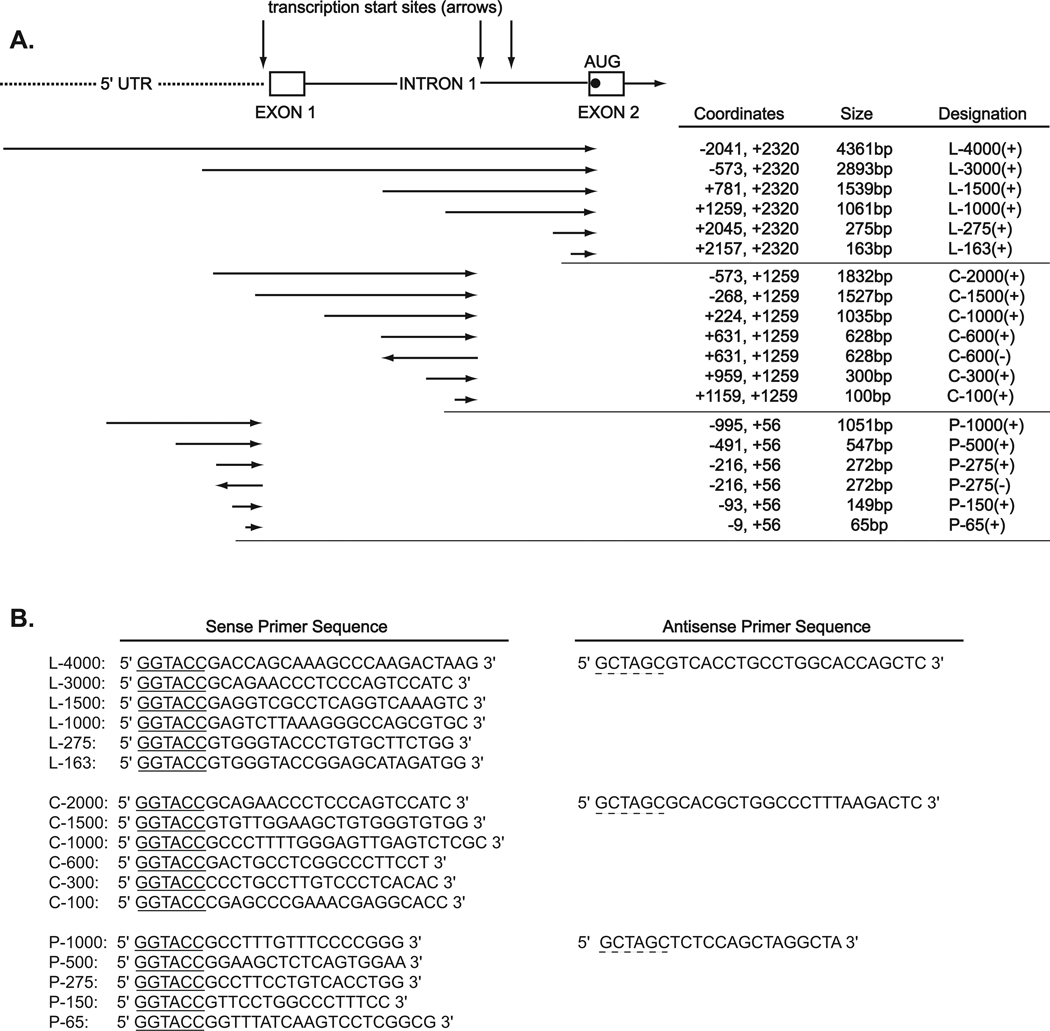
Fig 5. Diagrammatic representation of HYAL-2 promoter constructs.
Panel A includes a schematic diagram of the 5′ flanking region of the HYAL-2 gene, exon 1, intron 1 and part of exon 2 (contains the translation start site). Arrows show the relative position of transcription start sites for HYAL-2. Also included in panel A are the relative positions, cloning orientations and sizes of the HYAL-2 promoter constructs (drawn as horizontal arrows). The exact coordinates, sizes and designations are shown to the right. Panel B depicts the sense and antisense primer sequences used to generate the promoter constructs with underlined sequence delineating the engineered KpnI and NheI restriction sites.

