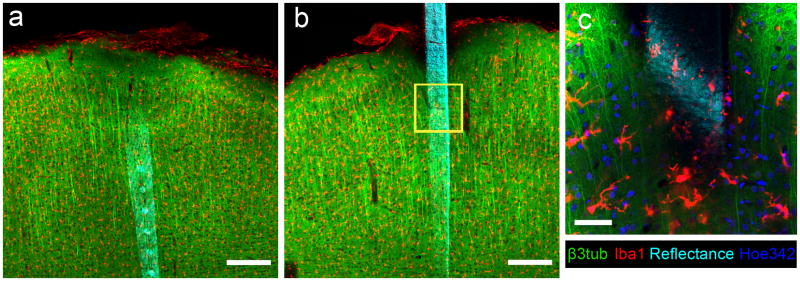
Figure 5.
Both sides of a tissue slice can be imaged around DCHist collected device. (a) Reflectance (cyan) from the traces and electrode sites of an implanted MEA are visible, along with markers for β3tub and Iba1. (b) The backside of this silicon device is visible after flipping the tissue section. (c) A magnified view of the yellow box in (b) shows the morphological characteristics of the labeled microglia (Iba1) and neurons (β3tub), and also nuclei (Hoe342) along with the device surface. Data taken under LSCM; (a, b) are highest intensity projections 150 μm thick; (c) is a single optical section. Device implanted into rat motor cortex for 24 hours. Scale bars are 200 μm (a,b), 50 μm (c). (For interpretation of the references to color in this gure legend, the reader is referred to the web version of the article.)

