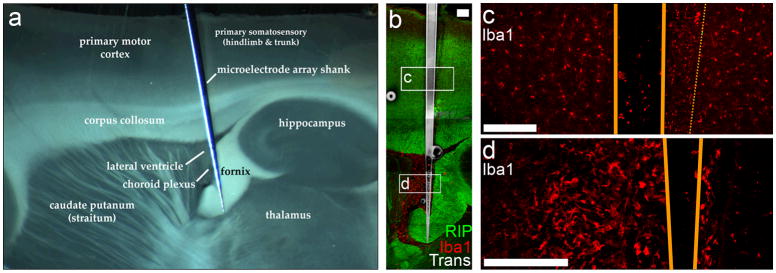
Figure 8.
In situ collection provides precise device location and implantation impact data. (a) A midbrain-implanted MEA device, collected in non-perfused tissue 6 hours after surgery, is imaged under dissection microscope and shown relative to neighboring anatomical brain structures. (b) Under LSCM, immunohistochemical data for oligodendrocyte (RIP) and microglia (Iba1) can be taken along the entire device. (c) An asymmetric activation of microglia to one side of the implanted device (highlighted with thin, dashed line) indicates device-implantation at a slight angle with respect to the inserter’s direction of travel, displacing tissue to one side. (d) Near the highly deformed fornix, a macrophage-filled ventricle was captured, preserving indications that a significant amount of damage and bleeding likely occurred in the lateral ventricle subsequent to the implantation. Device edges outline in orange in (c,d). Scale bars are 200 μm (b), and 50 μm (c, d). (For interpretation of the references to color in this gure legend, the reader is referred to the web version of the article.)

