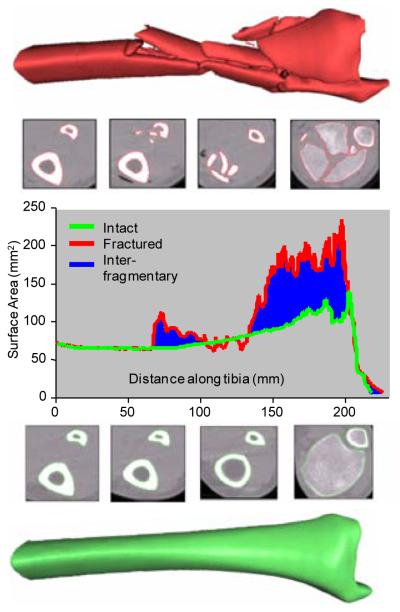
Figure 1.
The surface area for the fractured (red) and intact contralateral (green) are plotted along the length of the tibia. The total inter-fragmentary surface area is graphically represented by the blue area between the intact and fractured curves. The severe disruption and fragmentation visible in the fractured metaphysis illustrates comminution.

