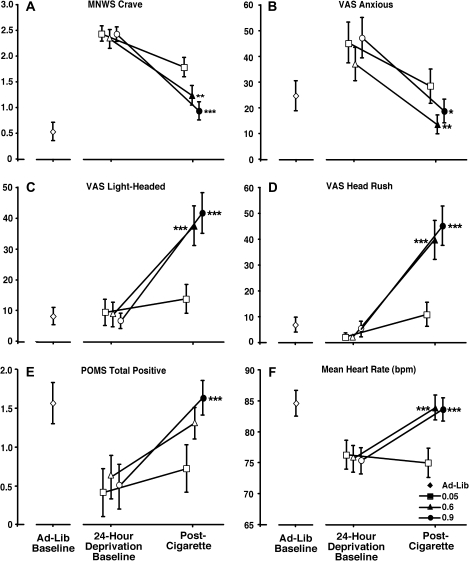
Figure 3.
Presents subject-rated (Panels A–E) and cardiovascular (Panel F) measures that varied as a function of nicotine yield. Filled circles represent a significant change from the 0.05-mg nicotine yield postcigarette measurement, while asterisks (*) represent the magnitude of that change. *p < .05, **p < .01, ***p < .001. Error bars represent ±1 SE.

