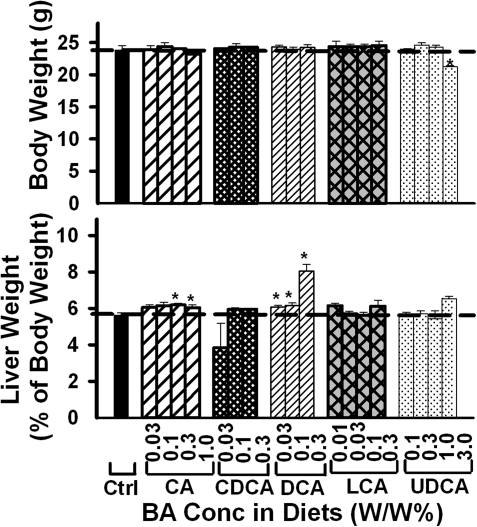
FIG. 1.
Body weight and relative liver weight of mice fed five BAs (CA, CDCA, DCA, LCA, or UDCA) at concentrations of 0.01, 0.03, 0.1, 0.3 1.0, or 3% in the diets for 1 week. Data are presented as mean ± SEM (n = 5). Asterisks represent statistically significant differences (p < 0.05) between control and treatment groups.

