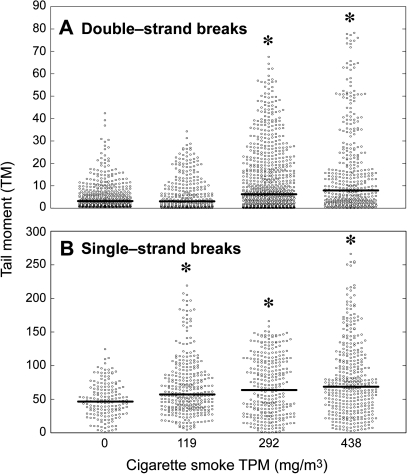
FIG. 1.
Distribution of SCGE data generated either in neutral (A) or in alkaline (B) environment, as related to the dose of whole-body CS exposure of mice. The data were generated by testing 100 nuclei per brain sample obtained from five mice in Group A, eight mice in Group B, eight mice in Group C, and five mice in Group D. The horizontal bold lines indicate the medians within each experimental group. *p < 0.01, as compared with the corresponding sham.

