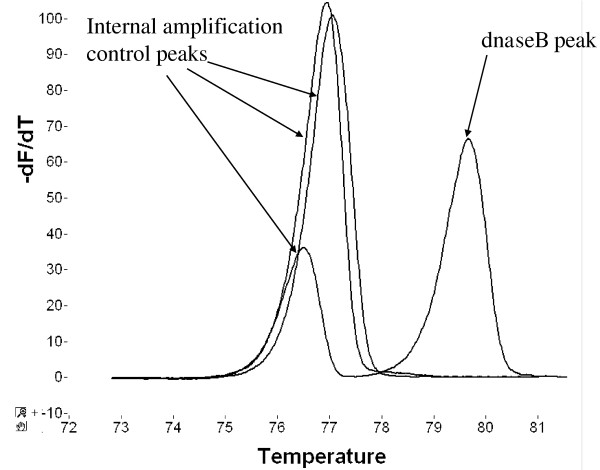
Figure 1.
Group A streptococcus (GAS) PCR derivative melting curves for three flocked throat swab specimens (one GAS PCR-positive and two GAS PCR-negative specimens). The GAS-PCR positive specimen shows both an internal amplification control (IAC) and dnaseB peak. Only IAC peaks are seen in the GAS-negative specimens, demonstrating that GAS was not detected and, in addition, that the PCR reaction was not inhibited.

