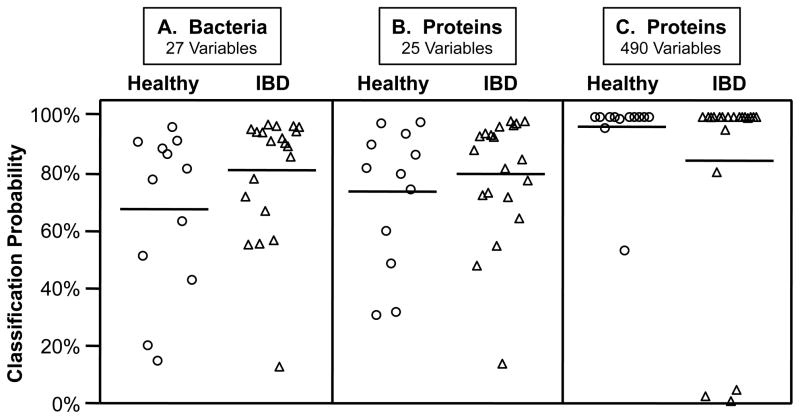
FIGURE 2.
Classification of healthy and IBD subjects by nearest shrunken centroids analyses of the amounts of the index bacterial phylotypes or proteins from intestinal MLI samples. Values are posterior probabilities: healthy (circles) and IBD (triangles). Means are solid horizontal lines and standard deviations are dashed lines (only the lower value is shown). Only second cohort subjects sampled in both cecum (CE) and sigmoid colon (SIG) were used in this analysis (n = 32), and both regions were analyzed separately. A: Bacterial population density values were generated using 15 qPCR assays: 14 index phylotypes (Table S2 and Figure S1) and one targeting all bacterial rRNA genes; the optimal classification solution (threshold = 0.175, error = 4/32) included all bacteria-region variables except Eubacterium 2766 from the cecum and Clostridium 12 from the cecum and sigmoid colon (27/30 phylotype-region variables). B and C: Proteins were enumerated by MALDI-MS. B: Classification from 25 protein-region variables (threshold = 1.788; error = 5/32) produced similar posterior probabilities as those from the bacterial analysis (A); C: The optimal classification solution (threshold = 0.670; error = 3/32) included 490 protein-variables (see Supporting Information for protein lists).

