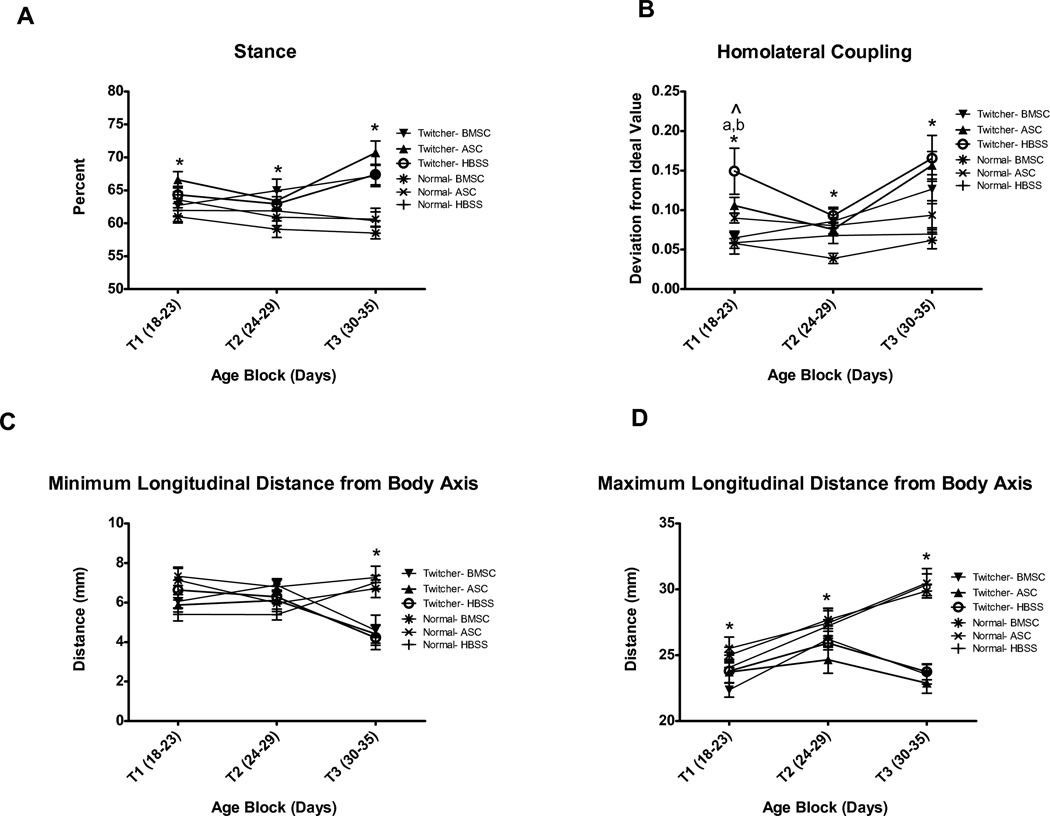
Fig. 4.
Automated gait analysis by Treadscan software is capable of discriminating between twitcher and normal genotypes by several measures. A) Percent Stance is significantly different between twitchers and normals at all ages tested. B) Homolateral coupling detects differences between twitchers and normals at all ages tested, but may be a somewhat variable measure to use prior to T2. C) Minimum longitudinal distance from body axis is less sensitive, discriminating between twitchers and normals only at T3 (days 30–35). D) Maximum longitudinal distance from body axis clearly detects genotype differences at all ages. * indicates significant (p<0.05) difference between twitcher and normal mice. ^ indicates significant (p<0.05) injection effect. ‘a’ denotes significant (p<0.05) difference between BMSC and HBSS twitchers by Bonferroni posthoc analysis and by a priori t-test. ‘b’ denotes significant (p<0.05) difference between BMSC and ASC twitchers by Bonferroni posthoc analysis.

