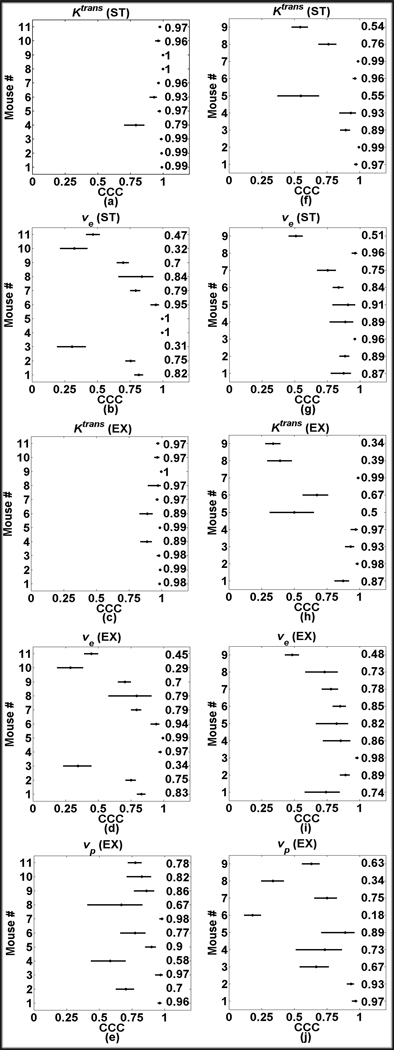
Figure 4.
Panels a–e show the CCC plots for the respective kinetic parameter in the voxel based analysis found using Gd-DTPA; the P846 data is shown in panels f–j. Each plot displays the CCC values (y-axis) and 95% CI for voxels obtained from each animal (x-axis). The nominal values are listed in the column on the right side of the plot.

