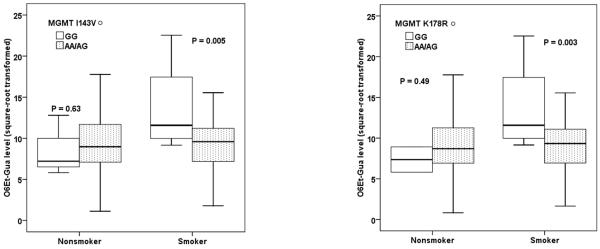
Fig.1. Box-plot of adduct level by genotype and smoking status.
The square-root transformed value of original DNA O6Et-Gua-adduct levels were associated with MGMT I143V (left panel) and MGMT K178R (right panel) in 297 subjects. P value was from ANCOVA F test. The solid line indicated median; the box extents marked the 25th and 75th percentile of the observed value, and the capped bars indicated the 10th and 90th percentile. Symbol indicated the outliers of adduct level.

