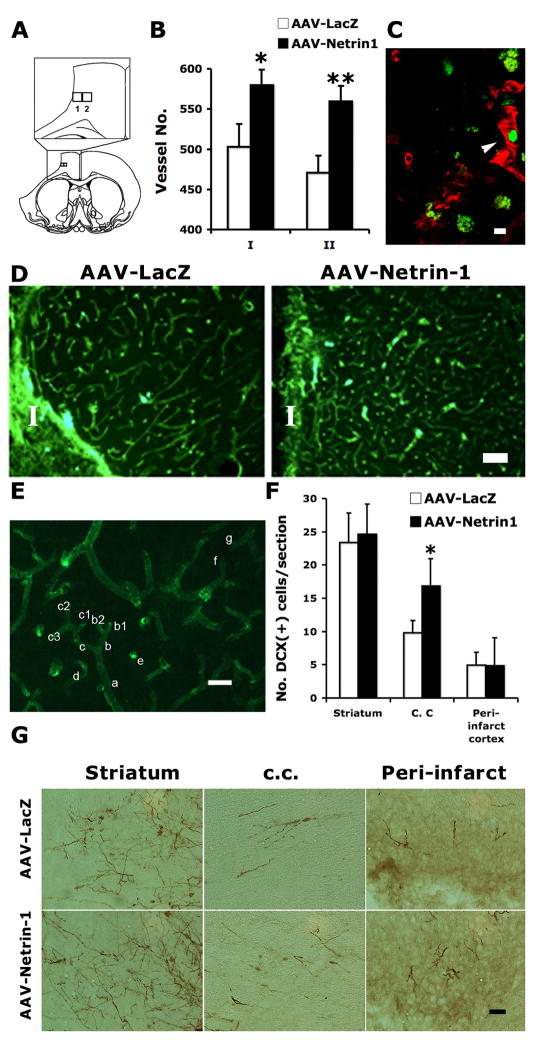
Figure 8. AAV-Netrin-1 gene therapy increases microvessel density in the peri-infarct cortex and preferentially increases immature neuron migration into ipsilateral white matter.
A, Diagrams showing the location of grids 1 and 2 in relation to ischemic infarct. Grid 1 covers a rectangular area of 280 × 250 μm adjacent to the infarct border. Grid 2 is medial to grid 1, which is the same size as grid 1. B, Blood vessels were counted in both grids in 4 serial sections following immunostaining with mouse-anti-rat RECA-1 antibody. There was a significant increase in the density of microvessels in stroke rats that received AAV-Netrin-1, compared to those that received AAV-LacZ in both counting areas. *: p<0.05; **: p<0.01. C, Co-localization between Ki67 (green) and mouse-anti-rat RECA1 in the peri-infarct of a rat receiving AAV-Netrin-1 suggests the presence of newly formed blood vessels (arrowhead). Scale bar: 10 μm. D, Representative photomicrographs showing the blood vessels stained with mouse-anti-rat RECA-1 antibody in the peri-infarct cortex of animals receiving AAV-LacZ and AAV-Netrin-1. I: ischemic core. Scale bar: 100 μm. E, An image of RECA-1 staining showing the labeled microvessels. The rules for microvessel counting are described in detail in the material and method section. Scale bar: 15 μm. F, There was a significant increase in the number of DCX immunoreactive cells detected in the ipsilateral corpus callosum below the ischemic infarct (*: p<0.05). However, there was no difference in the number of DCX cells quantified in either the striatum or peri-infarct cortex. G, Representative photomicrographs showing DCX immunoreactive neuroblasts in the ipsilateral striatum, corpus callosum (c. c.), and peri-infarct cortex at 5 weeks after gene therapy. Scale bar: 50 μm.

