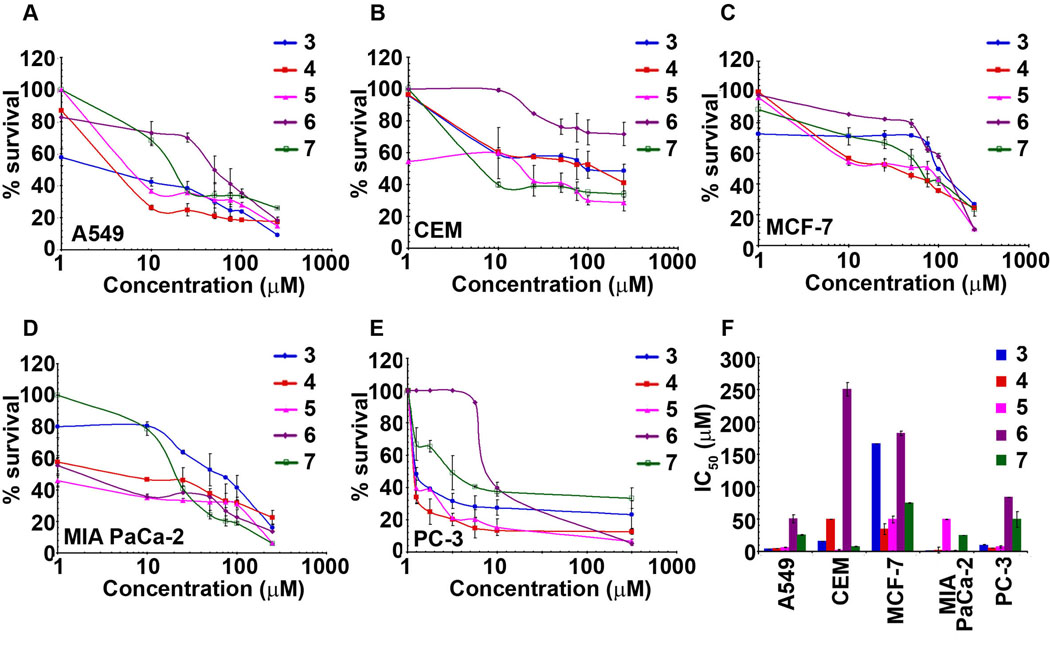
Fig. 6.
Cancer cells of varying tissue origin are sensitive to the noscapine analogs. Cells were treated for 48 h with increasing gradient concentrations of various noscapine analogs and the percentage of cell proliferation was measured using MTT assay. A, B, C, D and E represent the sensitivity profile the various cancer cells (A549, CEM, MCF-7, MIA PaCa-2, PC-3) to the five 7-position substituted benzofuranone noscapine analogs. The plot of % cell survival versus noscapine analog concentrations for cancer cells in them. F is a bar-graphical representation of IC50 values of noscapine analogs in various cancer cells used in our study. The values and error bars shown in all the graphs represent average and standard deviations, respectively, of three independent experiments (p <0.05).

