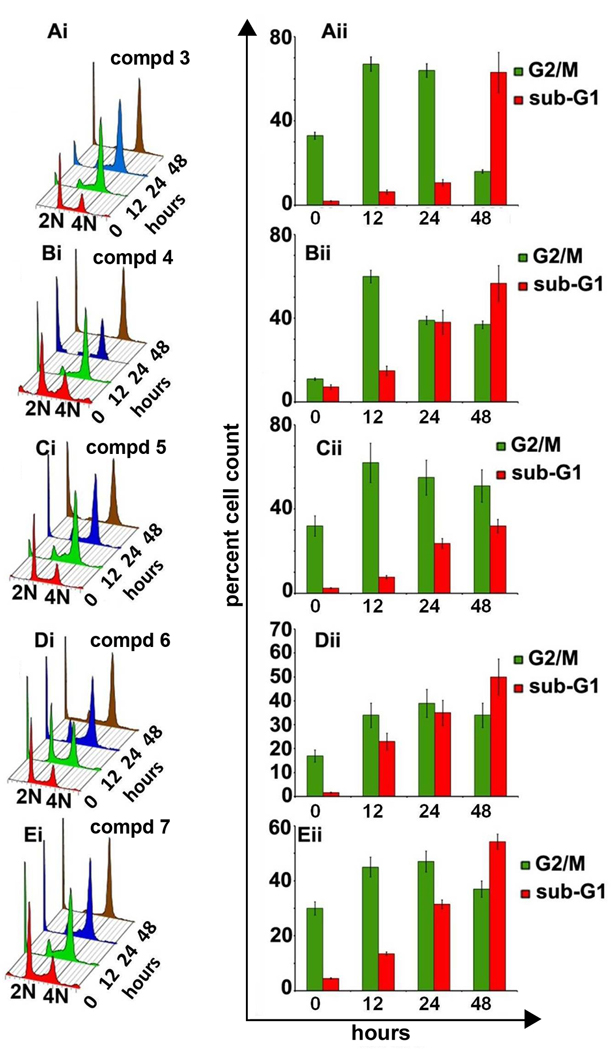
Fig. 8.
Panels Ai to Ei depicts cell-cycle distribution of MDA-MB-231 cells in a three-dimensional disposition as determined by flow-cytometry at different time point upon treatment with 25 µM concentration of compounds 3–7. Results are representative of three experiments done in triplicate. The right panels (Aii to Eii) show bar-graph representation of the percent G2/M and sub-G1 populations at different time points for compounds 3–7. Values and error bars shown in the graph represent mean and standard deviation, respectively, of three independent experiments performed in triplicate.

