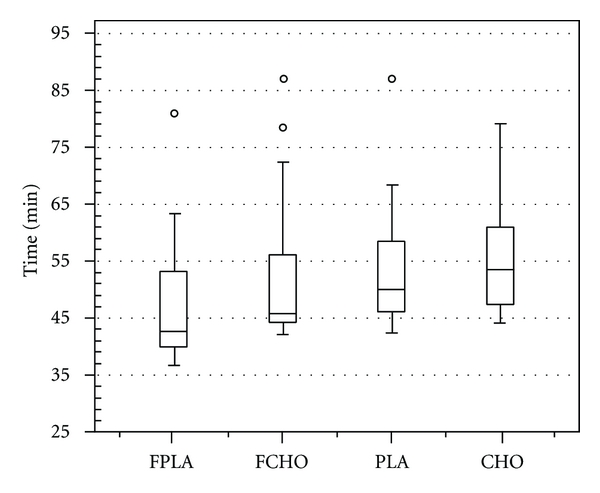
Figure 1.

Time-to-exhaustion. Boxplot of the time-to-exhaustion for the 4 different trials (FCHO: carbohydrate rinse in fasted state; FPLA: placebo in fasted state; CHO: carbohydrate rinse in fed state; PLA: placebo in fed state). The thick line in the boxes represents the median, the extremes of the boxes the 25 and 75% percentiles, and the whiskers the minimum and maximum values. Outliers are indicated by a circle when more than 1.5 times the interquartile ranges beyond the 75% quartile.
