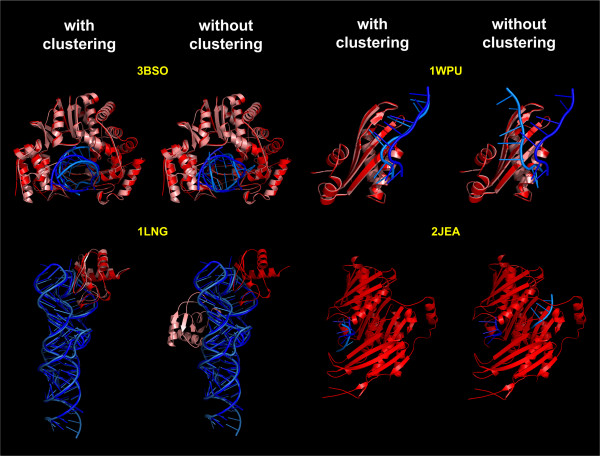
Figure 7.
Examples demonstrating the utility of clustering the best-scored decoys for the identification of native-like RNP structures. Four cases scored by the DARS-RNP potential have been selected from the analysis presented in Figure 6. The structure with the lowest energy (score) is selected as a representative of a cluster. Native structures are in dark colors (blue -RNA and red - protein), while decoys are indicated by light colors (light blue - RNA and salmon pink - protein). Bigger components are superimposed.

