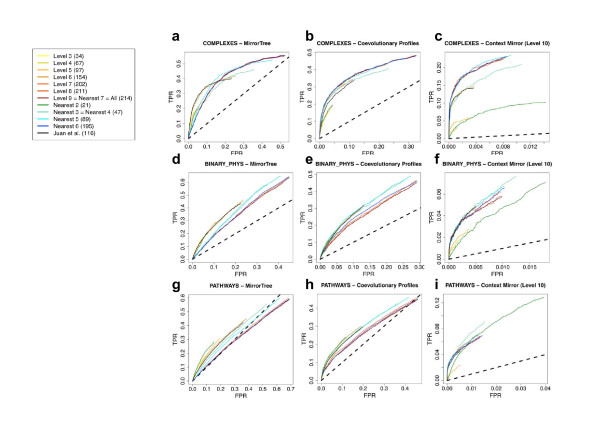
Figure 2.
Matrix of partial ROC curves. The partial ROC curves evaluate the performance of a given methodology for a given set of interactions using a given set of reference genomes. The rows represent the interaction datasets and the columns the methods. For a given combination method-dataset, the colored curves represent the organism sets according with the included legend. In the legend, the number of organisms within each subset is indicated within brackets. The dotted line highlights the diagonal of the ROC plots, which represents the background performance expected for a random method.

