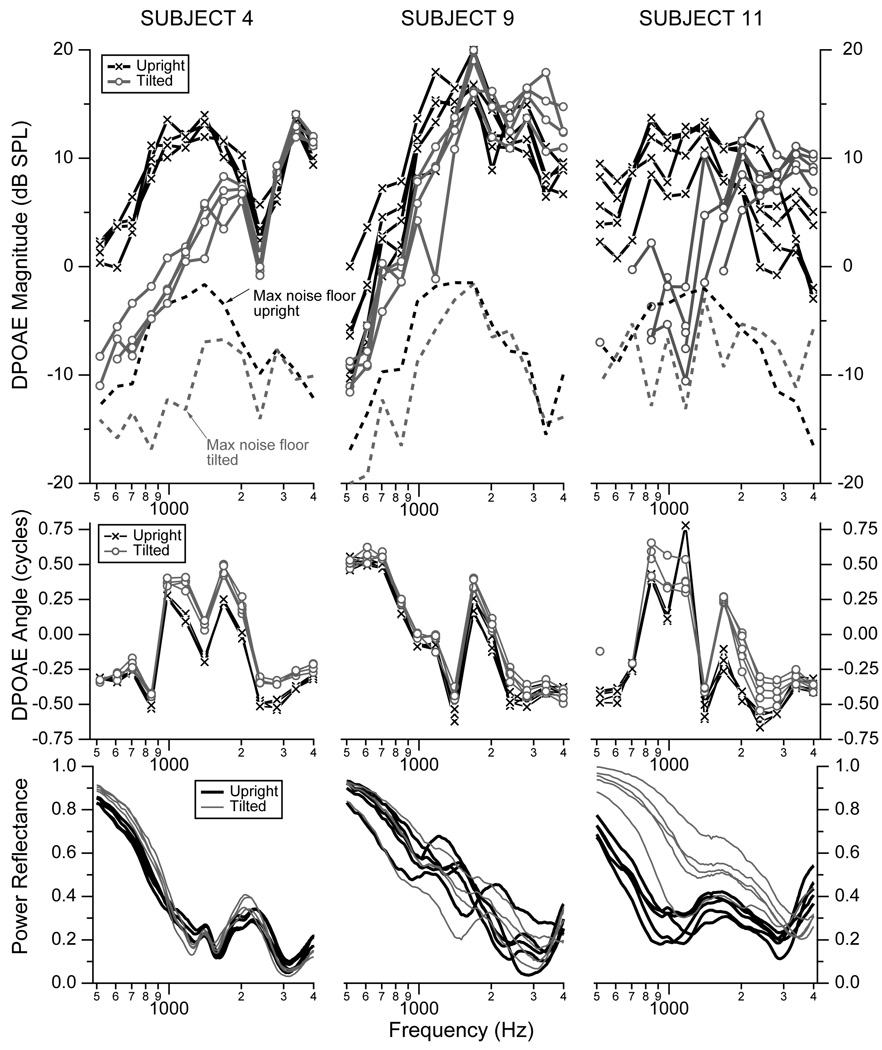
Figure 2.
DPOAE magnitudes (upper row), DPOAE angles (middle row) and power reflectance (lower row) from the left ears of Subject 4 (left column), Subject 9 (middle column), and Subject 11 (right column). Measurements plotted in black correspond to the upright position, and those plotted in gray correspond to the subject tilted at −45° to the horizontal with an estimated ICP on the order of 22 mm Hg (about 30 cm H20 or 293 daPa). The maximum noise floor measured for each subject at each frequency across all measurement sessions is plotted in dashed lines on the magnitude plots. Noise levels are generally higher at low frequencies for upright postures (black dashed lines) because the measurements were stopped once the signal-to-noise level reached 15 dB. All DPOAE data with a magnitude within 6 dB of the noise floor were assumed to be corrupted by noise and were not plotted. The DPOAE magnitudes and angles are plotted as a function of the frequency f2.

